

The last two weeks have been chock full of US economic data, much of it conflicting. The latest example: The New York Fed’s Empire State Manufacturing Index sank into deeply negative territory in July, suggesting a steep contraction in Northeastern factory activity … but the Philadelphia Fed’s counterpart jumped into positive territory, suggesting factory activity expanded on the eastern seaboard. This follows a short run of conflicting manufacturing output (negative) and Institute for Supply Management (ISM) Manufacturing Purchasing Managers’ Indexes, or PMIs (positive). Monthly inventory data, which isn’t adjusted for inflation, is high and rising—but quarterly inventories, which are inflation-adjusted, continue detracting from GDP. We see a broad, important takeaway for investors to keep in mind here: Economic data remain quite volatile post-COVID, making it unwise to read into any one metric, or even a small gathering of metrics.
Exhibits 1 – 6 show an array of monthly data from January 2017 through the latest reading available. As you will see, from PMIs to retail sales to factory orders and beyond, most of these are far more volatile since January 2020. Not just during the initial lockdowns, but afterward, with one exception, the month-to-month moves are bigger across the board.
Exhibit 1: Regional Manufacturing PMIs
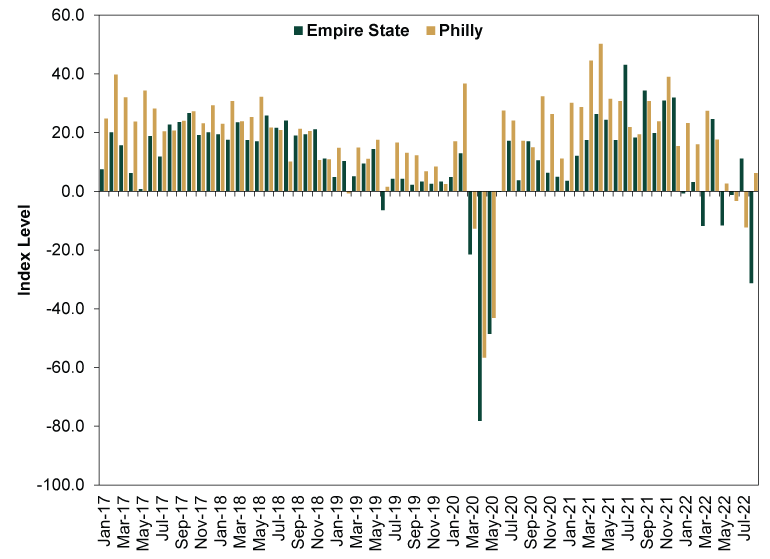
Source: FactSet, New York Fed and Philadelphia Fed, as of 8/18/2022. Readings over zero indicate expansion.
Exhibit 2: ISM PMIs
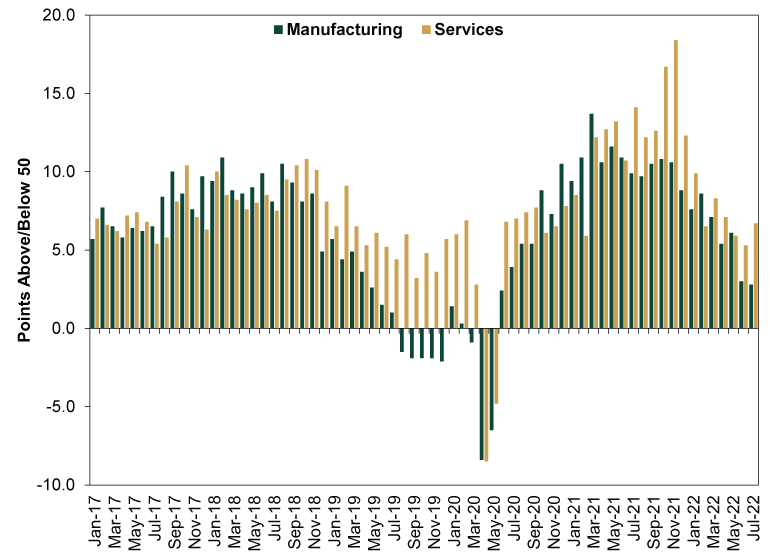
Source: FactSet, as of 8/18/2022. Readings over 50 indicate expansion.
Exhibit 3: Retail Sales
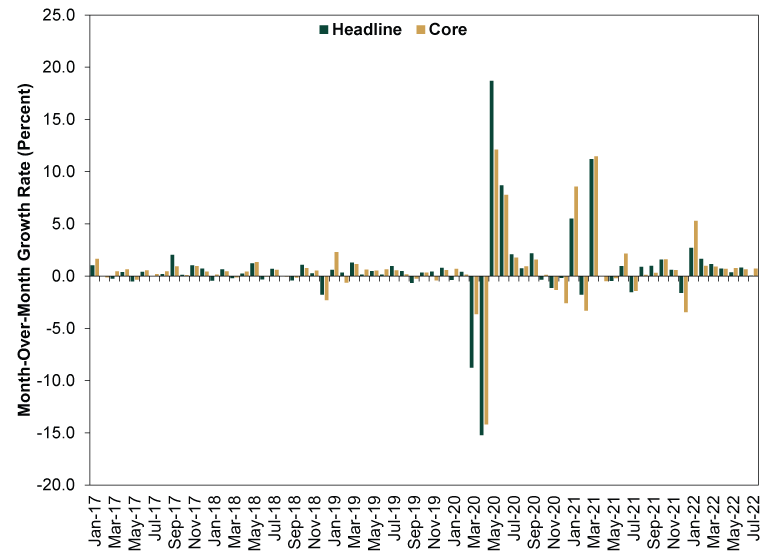
Source: FactSet, as of 8/18/2022. Core retail sales exclude motor vehicles & parts and gas station sales. Figures aren’t inflation-adjusted.
Exhibit 4: Real Consumer Spending

Source: FactSet, as of 8/18/2022.
Exhibit 5: Durable Goods Orders
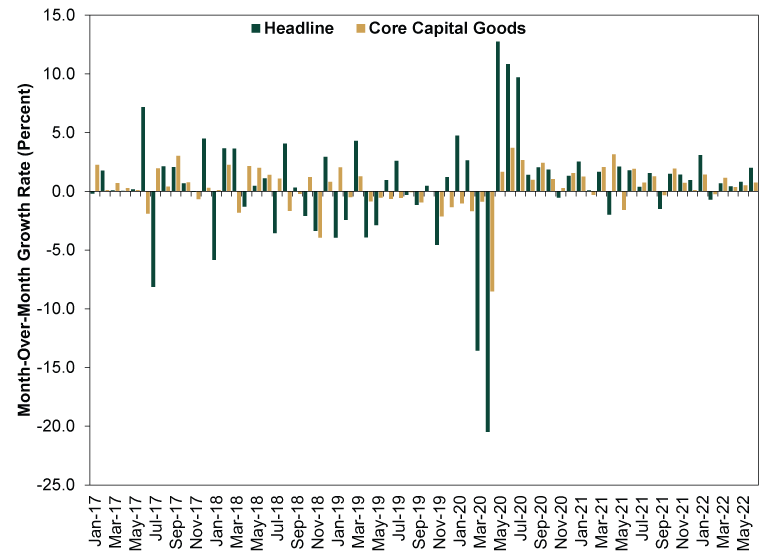
Source: FactSet, as of 8/18/2022. Core capital goods orders exclude defense and aircraft.
Exhibit 6: Manufacturing and Mining Output
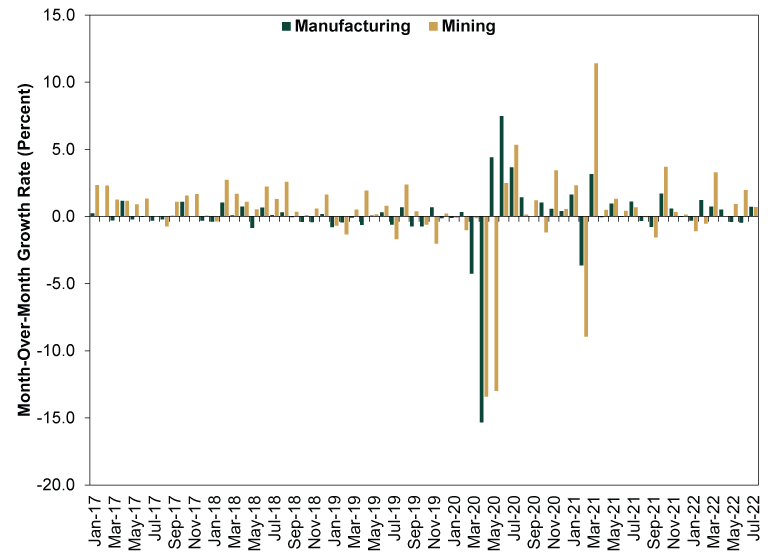
Source: FactSet, as of 8/18/2022. These subindexes are used in lieu of headline Industrial Production to omit skew from Utilities, which are influenced heavily by weather.
In some of these, the outsized swings during and after lockdowns make the relative volatility in the surrounding months hard to see. So here is another way to assess it. Exhibit 7 summarizes the average monthly movement (meaning, the absolute value of each monthly change) in each of these series before the pandemic (January 2017 through December 2019) and after the initial post-reopening boom faded (from September 2020 onward). The PMI rows show the average movement in points, while the rest show average growth rates. All save durable goods and core capital goods orders continue notching bigger swings today.
Exhibit 7: Comparing Pre- and Post-Pandemic Volatility
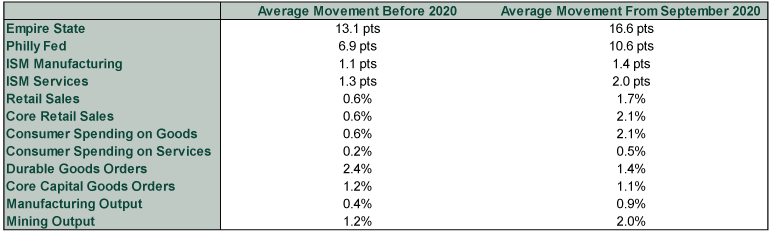
Source: FactSet, New York Fed and Philadelphia Fed, as of 8/18/2022.
In our view, durable and core capital goods orders’ relative calm isn’t as much of an outlier as it might appear. Rather, we suspect it is a figment of the same factors disrupting other monthly series: shortages and supply bottlenecks. Those have caused big gyrations in output-oriented categories, which hinge on component availability as well as demand. But they have also caused demand for goods to accumulate, resulting in a steady flow of orders for long-lasting machinery, electronics and other merchandise. Hence, this normally bouncy series has become oddly steady. Wonderful as it would be to portray this as a sign of robust business investment, we think it is more likely yet another sign things aren’t quite back to normal yet.
GDP, too, remains more bouncy now, as Exhibit 8 depicts. In the run up to 2020, the average quarterly movement was 2.5% in either direction. From Q4 2020 (after that big Q3 reopening boom) onward, it is 4.2%. And that is to say nothing of all the weirdness underneath, like imports and inventories hiding strong consumer spending in Q1 and Q2 of this year. More post-COVID dislocations.
Exhibit 8: GDP Is Bouncier, Too
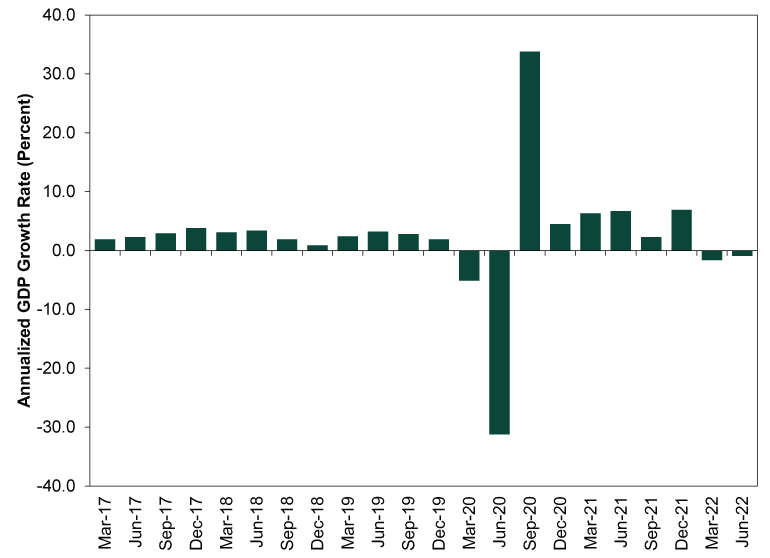
Source: US Bureau of Economic Analysis, as of 8/17/2022.
Setting aside all of the political implications, which are legion, we think this all underscores why the National Bureau of Economic Research has demurred on declaring a recession despite two consecutive GDP contractions. None of the above monthly data definitively say we are in a recession. Nor do they definitively say we aren’t in one. They are a mixed bag, and the factors making them so volatile and contradictory are generally divorced from core economic fundamentals.
The good news, in our view, is stocks can see through all of this confusion. We think this is a big reason why the rally that began in mid-June continues. Recession warnings are everywhere and have been for weeks, making them well-known to stocks. Yet if we are in a recession now, all the mixed, bouncy data so far suggest it is a very mild one. In our view, all signs point to the US economy muddling through the best it can in the face of some external headwinds. Seems to us that qualifies as a positive surprise relative to all today’s deep recession fears. That doesn’t mean this rally is for sure a new bull market, as sentiment could trigger another downdraft. But it is a good backdrop for a recovery, whether now or a bit later.