

Summary
At its meeting on 23 July 2026, the Governing Council decided to keep the three key ECB interest rates unchanged. The outlook for energy prices, while highly volatile, stands close to the baseline of the June 2026 Eurosystem staff macroeconomic projections for the euro area and well above the levels recorded prior to the conflict in the Middle East. Uncertainty remains high and the full inflationary impact of the energy shock has yet to play out. The Governing Council is therefore closely monitoring the intensity and duration of the shock, as well as its indirect and second-round effects. It is committed to setting monetary policy to ensure that inflation stabilises at its 2% target in the medium term.
With its decision on 23 July, the Governing Council remains well positioned to navigate the uncertainty caused by the conflict. It will follow a data-dependent and meeting-by-meeting approach to determining the appropriate monetary policy stance. In particular, the Governing Council’s interest rate decisions will be based on its assessment of the inflation outlook and the risks surrounding it, in light of the incoming economic and financial data, as well as the dynamics of underlying inflation and the strength of monetary policy transmission. The Governing Council is not pre-committing to a particular rate path.
Economic activity
Recent information points to some improvement in economic activity in the second quarter of 2026, even though the conflict in the Middle East remained a headwind. Surveys suggest that activity in the services sector has partly recovered, after weakening markedly in the immediate aftermath of the energy shock. Digital services have been robust, in part owing to the increasing contribution from AI-related activity. Manufacturing has continued to hold up, supported by firms building up stocks to guard against supply chain risks, as well as by higher defence spending. Unemployment stood at 6.2% in May, close to historical lows. At the same time, job postings have continued to decline, and both firms and households expect the labour market to remain weaker than before the conflict.
Forward-looking indicators suggest that economic growth will remain modest in the near term, weighed down by the energy shock and related uncertainties. Yet the fundamental drivers of medium-term growth remain intact. Private consumption, investment in new digital technologies, government spending on defence and infrastructure, and some recovery in exports should all contribute to overall growth momentum.
The Governing Council reiterated its call for urgent action to strengthen the euro area economy while maintaining sound public finances. Simplifying and harmonising rules across the EU’s Single Market, accelerating the energy transition and completing the savings and investments union are key building blocks. Fiscal responses to the energy shock should be temporary, targeted and tailored. The positive vote in the European Parliament in July 2026 was a significant milestone on the path to establishing the digital euro. The Governing Council welcomes the shared objective of the European Parliament, EU Council and European Commission of reaching agreement by the end of 2026 on the Single Currency Package. The digital euro will complement physical cash with its digital equivalent, providing a means of payment for any digital transaction throughout the euro area.
Inflation
Inflation declined to 2.8% in June 2026, from 3.2% in May. Energy price inflation declined to 8.5%, after 10.8% in May, while food price inflation fell from 1.9% to 1.5%. Inflation excluding energy and food eased to 2.4%, from 2.6% in May, with goods inflation decreasing from 0.9% to 0.7% and services inflation from 3.5% to 3.2%.
The energy shock continues to feed into higher prices. It is becoming more expensive for firms to source inputs and they therefore expect to put up their selling prices. While developments in underlying inflation have remained contained, the full effects of the energy shock have yet to play out. The ECB wage tracker and the results of surveys on wage expectations continue to indicate moderate wage growth over the coming quarters. Rising labour productivity has also helped contain growth in unit labour costs. Inflation expectations over shorter horizons remain at elevated levels. Most measures of longer-term inflation expectations stand at around 2%, supporting the stabilisation of inflation around target in the medium term.
While energy price inflation declined in June, its rise since the start of the conflict – and its impact on food, goods and services price inflation – is likely to keep inflation well above target into the first half of 2027. Inflation should then decline, as energy prices are expected to fall and other prices should rise more slowly. However, the conflict remains a major source of uncertainty. The Governing Council is therefore closely monitoring the size and persistence of the energy price increase, and how it feeds through to price and wage-setting, inflation expectations and overall economic dynamics.
Risk assessment
The risks to the growth outlook are to the downside. While the Memorandum of Understanding agreed between the United States and Iran in June 2026 constituted a first attempt to resolve the conflict, the weeks in the run-up to the Governing Council’s meeting on 23 July brought renewed setbacks, and the geopolitical situation remains fragile. Renewed disruption of energy supplies could increase energy prices further and for longer than currently expected. This would weigh on real incomes, spending and investment. A worsening of global financial market sentiment or a tighter supply of credit could dampen demand. Additional frictions in international trade could also further disrupt supply chains, reduce exports and weaken consumption and investment. Other geopolitical tensions, in particular Russia’s unjustified war against Ukraine, remain a major source of uncertainty. By contrast, growth could turn out to be higher if the economy and energy markets were to adapt more quickly than expected to the disruption caused by the conflict in the Middle East or if the conflict was resolved sustainably. Moreover, planned defence and infrastructure spending, and reforms to enhance productivity and complete the Single Market, as well as euro area firms adopting new technologies, may drive up growth by more than expected.
The risks to the inflation outlook are to the upside. The energy shock could intensify further and its effects on other prices and wages could be stronger than currently expected. The longer energy prices stay high, the more likely they are to drive up broader inflation through indirect and second-round effects. Ongoing trade tensions could give rise to more fragmented global supply chains, curtail the supply of critical raw materials and worsen capacity constraints in the euro area economy. Extreme weather events – as illustrated by the ongoing heatwaves – and the unfolding climate and nature crises more broadly, could drive up food prices by more than expected. By contrast, inflation could turn out to be lower if the conflict in the Middle East was resolved sustainably or if indirect or second-round effects proved less pronounced than anticipated. More volatile and risk-averse financial markets could weigh on demand and thereby lower inflation as well.
Financial and monetary conditions
Overall financial conditions have become slightly tighter since the Governing Council’s meeting on 11 June 2026, consistent with the increase in the key ECB interest rates. Bank lending rates for firms and the cost of issuing market-based debt remained unchanged in May, at 3.6% and 4.0% respectively. The annual growth rate of bank lending to firms increased to 4.0%, from 3.4% in April, but this was partly offset by slower growth in corporate bond issuance, which fell from 4.5% to 3.4%. Credit standards for business loans tightened somewhat in the second quarter, as reported in the July 2026 euro area bank lending survey. Demand for loans to firms increased slightly, driven by higher working capital needs but also by borrowing for fixed investment by large firms.
Mortgage rates rose to 3.5% in May, after 3.4% in April, while mortgage lending growth edged up to 3.1%. Credit standards for mortgages tightened in the second quarter as banks became more concerned about the economic risks faced by their customers and less willing to take on risks themselves. Demand for mortgages decreased on the back of deteriorating consumer confidence and higher interest rates.
Monetary policy decisions
At its meeting on 23 July 2026, the Governing Council decided to keep the three key ECB interest rates unchanged. Accordingly, the interest rates on the deposit facility, the main refinancing operations and the marginal lending facility remain at 2.25%, 2.40% and 2.65% respectively.
The asset purchase programme and pandemic emergency purchase programme portfolios are declining at a measured and predictable pace, as the Eurosystem no longer reinvests the principal payments from maturing securities.
Conclusion
The Governing Council is committed to setting monetary policy to ensure that inflation stabilises at its 2% target in the medium term. It will follow a data-dependent and meeting-by-meeting approach to determining the appropriate monetary policy stance. Its interest rate decisions will be based on its assessment of the inflation outlook and the risks surrounding it, in light of the incoming economic and financial data, as well as the dynamics of underlying inflation and the strength of monetary policy transmission. The Governing Council is not pre-committing to a particular rate path.
In any case, the Governing Council stands ready to adjust all of its instruments within its mandate to ensure that inflation stabilises sustainably at its medium-term target and to preserve the smooth functioning of monetary policy transmission.
1 External environment
Global economic activity has proven resilient in the first half of 2026 as the ongoing artificial intelligence (AI) and technology boom, alongside precautionary purchases, support growth. The re-escalation of the conflict in the Middle East, however, is clouding the near-term outlook. Strong demand for high-tech products is continuing to support investment and trade, particularly in the United States, while the frontloading of purchases of energy products and goods potentially affected by supply shortages has temporarily boosted activity. Manufacturing producer price inflation has accelerated significantly as the energy price shock propagates through the global economy, with pipeline pressures strongest among AI hardware exporters.
Global economic activity remained robust in the first half of 2026, and soft indicators point to continued resilience in the near term. The global composite output Purchasing Managers’ Index (PMI), excluding the euro area, held broadly stable in June at 52.2, remaining firmly in expansionary territory. Strong manufacturing output has been a key support to activity, reflecting buoyant demand for high-tech products and the frontloading of purchases of energy and energy-related products to cushion disruptions from the conflict in the Middle East. While the boost to trade and activity from the latter two factors is not expected to persist over the medium term, the impact of the technology boom is expected to be longer-lasting, reflecting planned strong investment in AI infrastructure and AI adoption.
Global trade continues to be supported by high demand for high-tech products, although supply pressures persist. Growth in global real imports, excluding the euro area, was 1.8% quarter on quarter in the first quarter of 2026, up from 1.1% in the fourth quarter of 2025. Nominal trade data (available up to April) confirm that global imports, excluding the euro area, have strengthened since the start of the year, possibly also reflecting price increases. Global imports of AI-related goods and semiconductors have risen significantly since the start of the year and remain the key driver of the robust growth in trade observed so far (Chart 1). The contribution of energy goods imports has turned positive since the outbreak of the conflict in the Middle East, largely reflecting the sharp increase in energy prices. Global manufacturing PMI new orders, excluding the euro area, also remained in expansionary territory in June, reflecting strong demand for AI-related goods and the frontloading of consumer goods that could be subject to additional US tariffs once the temporary tariffs introduced in February 2026 expire on 24 July. Supply chain pressures have eased somewhat since the June 2026 Governing Council meeting, but they remain above normal levels and the recent re-escalation of the conflict between the United States and Iran might reverse some of these gains. Traffic through the Strait of Hormuz improved towards the end of June but has since fallen back owing to the conflict re-escalation, which has increased uncertainty about the near-term outlook for global economic activity and trade.
Chart 1
World (excluding euro area) goods import values by category
(annual percentage changes, percentage point contributions, de-meaned)
Sources: Trade Data Monitor and ECB staff calculations.
Notes: Import data in nominal values. Annual percentage changes and contributions for reported goods categories are calculated as deviations from their respective mean values over the period 2019-2023. “AI-related, semiconductors” comprises AI-related items, semiconductors (downstream and upstream) and other high-tech product sub-categories. The latest observations are for April 2026.
Oil prices fell after the US-Iran Memorandum of Understanding (MoU) was agreed, but renewed strikes are making the situation highly volatile. The price of Brent crude oil initially fell sharply following the signing of the MoU between the United States and Iran, under which both parties committed to restoring unimpeded traffic through the Strait of Hormuz. More recently, however, it rose again following renewed military strikes and the declaration by President Trump that the ceasefire was over, standing 1% lower overall than on 11 June (the beginning of the review period). European gas prices also fell following the signing of the MoU but more than retraced their decline after the resumption of strikes to stand 24% higher than at the start of the review period. The divergence between oil and gas prices reflects two main factors. First, European gas storage levels remain historically low for the time of year, putting upward pressure on gas prices. Second, although weaker Asian demand provided some relief, this was less pronounced in the gas market than in the oil market. As a result, price developments of the two commodities differ markedly in relative terms: while oil prices are currently 30% above their pre-conflict level, gas prices are 97% higher. Food commodity prices have risen by 19% over the review period, led by a 42% surge in cocoa prices amid concerns that the El Niño conditions that formed in June (and are forecast to strengthen) would disrupt supply over the coming months. By contrast, upside risks from fertiliser prices eased, with prices returning to pre-conflict levels amid the earlier fall in natural gas input costs. Metal prices have declined by 3%, as expectations of a normalisation of aluminium supplies from the Middle East following the restart of an alumina plant in Abu Dhabi that had been damaged in the initial stages of the conflict more than offset concerns over the recent resumption of strikes.
Inflationary pressures have risen further but, so far, largely remain limited to energy prices. Global headline inflation across the member countries of the Organisation for Economic Co-operation and Development (OECD) excluding Türkiye rose to 3.5% in May, from 3.3% in the previous month (Chart 2). The rise in headline inflation was predominantly due to higher energy inflation. While core inflation (excluding food and energy prices) also rose marginally (by 0.1 percentage points) in May, it still appears to be on a declining trend. Nevertheless, upside risks remain. Producer price inflation accelerated significantly following the energy price shock, with the strongest acceleration observed among AI hardware exporters in Asia, including Malaysia, South Korea, Taiwan and Thailand. Production in these countries is energy intensive and dependent on energy imports from the Gulf region, while strong global demand for AI goods is facilitating the pass-through of the energy price shock to AI hardware prices. Additional price pressures may also arise from the surge in global shipping costs, especially for routes to Asia, amid higher demand for cargo, reflecting robust trade dynamics. Overall, risks to global inflation in the near term remain tilted to the upside.
Chart 2
OECD CPI inflation
(year-on-year percentage changes, percentage point contributions)
Sources: OECD and ECB staff calculations.
Notes: The OECD aggregate includes euro area countries that are OECD members and excludes Türkiye. It is calculated using OECD consumer price index (CPI) annual weights. The latest observations are for May 2026.
In the United States, economic activity has remained resilient, while inflation has remained elevated. US macroeconomic data have recently surprised on the upside, supported by the AI boom and improved resilience to oil supply shocks owing to increased domestic supply of shale oil. Rising retail energy prices have depressed annual real disposable income growth to around zero, despite elevated tax refunds earlier in the year. Consumption growth remains robust but is increasingly supported by lower savings, which pushed the savings rate down to a very low 3% in May, and higher consumer borrowing. The growing reliance on dissaving and borrowing, coupled with low real income growth, limits the potential for further robust consumption growth going forward. Investment growth continues to be driven by AI-related spending, which remains highly concentrated among a few large firms, leaving the economy exposed to idiosyncratic risk should the investment cycle turn. Given its high import intensity, the AI boom is also continuing to support US imports, which might record another stronger-than-expected rise in the second quarter. Inflation surprised on the upside in May but decelerated in June. Headline CPI inflation slowed to 3.5% year on year in June from 4.2% in May, mainly reflecting a decline in energy prices, while core CPI inflation retreated more modestly to 2.6%. This moderation may prove short-lived, however, as the re-escalation of the conflict in the Middle East has pushed energy prices up again. At its first meeting under its new Chair, Kevin Warsh, in June, the Federal Open Market Committee kept rates on hold but revised up its median projected policy path, with nine out of the 18 participants now expecting a rate hike this year, compared with none in March.
Economic activity in China weakened markedly in the second quarter of 2026, with softening domestic demand weighing on headline growth. Real GDP growth slowed sharply from 5.0% year on year in the first quarter to 4.3% in the second quarter, which was below market expectations. Monthly data point to a further deterioration in domestic demand, with year-on-year retail sales growth falling to near zero in the second quarter and investment contracting further – a weakness that is unprecedented in China outside the pandemic period. The decline in retail sales mainly reflects goods purchases, which were affected by a scaling-back of the Government’s consumer goods subsidy schemes, while the weakness in investment reflects in part a renewed deterioration in the real estate sector. In addition, the Government stepped up its “anti-involution” campaign in the second quarter to address overcapacity and excessive price competition, which is likely to be weighing further on investment. In June nominal goods exports (in US dollars) surged by 27% year on year, driven by AI-related demand, while imports rose even more strongly, by 36%, owing to higher energy prices and AI-related demand. Export prices, meanwhile, followed producer prices out of deflationary territory in the second quarter, driven mainly by sectors affected by AI demand and energy prices, ending a multi-year period of export price deflation.
In the United Kingdom, economic activity appears to be slowing following some rebound at the start of the year. Monthly GDP declined by 0.1% month on month in April, and the composite PMI fell further below the neutral threshold, to 49.3 in June (from 49.7 in May and 52.6 in April), as weakness in services activity more than offset stronger manufacturing output. Real GDP growth is therefore expected to slow in the second quarter of 2026 relative to the first quarter. Headline inflation stood at 2.8% in May, unchanged from April but below the 3.3% recorded in March. Headline inflation is continuing to surprise on the downside, mostly reflecting easing food and core goods inflation, while services inflation picked up slightly. Energy inflation increased further, supported by higher fuel prices. A higher energy price cap announced for the period from July to September is expected to add upward pressure over the summer. Evidence of indirect and second-round effects from higher oil prices remains limited at this stage. Measures of inflation expectations rose significantly in the immediate wake of the energy price shock but have since softened somewhat. Private sector wage growth has continued to moderate amid signs of a further loosening of the labour market, which should help to contain second-round effects. The Bank of England kept its policy rate unchanged at 3.75% at the June meeting of its Monetary Policy Committee.
2 Economic activity
Euro area GDP was unchanged in the first quarter of 2026, but expanded by 0.3%, quarter on quarter, excluding volatile Irish data. Domestic demand weakened in the first quarter, as private consumption growth slowed slightly and investment fell – mainly in construction. Incoming data suggest that the war in the Middle East had contained but uneven effects on activity in the second quarter, with notable differences across sectors. Consumer-related services were the most affected, although survey evidence points to a partial recovery following the initial shock. By contrast, digital services and the manufacturing sectors remained resilient despite higher energy prices and elevated uncertainty. This resilience partly reflects an increase in investment related to artificial intelligence (AI) and firms building up inventories to mitigate supply chain risks as well as increased defence spending. The labour market remained resilient overall but has lost momentum, with short-term indicators suggesting weaker employment momentum in the second quarter of 2026. Forward-looking indicators suggest that growth is likely to remain modest in the near term. Uncertainty remains elevated amid a return to military operations in the Middle East following the temporary ceasefire. At the same time, a highly fragile global geopolitical environment continues to contribute to volatility in oil prices and to weigh on the outlook. Nevertheless, over the medium term domestic demand is expected to be bolstered by a recovery in real incomes – supported by the expected normalisation of energy prices, a resilient labour market and rising government spending on infrastructure and defence. These factors are expected to be complemented by increased investment related to AI and the energy transition.
Euro area real GDP was unchanged in the first quarter of 2026, but grew by 0.3% when excluding volatile Irish data, according to the third Eurostat national account release from 15 July. The decomposition of demand shows that private consumption growth weakened slightly in the first quarter, and investment contracted, while changes in inventories made a marginal positive contribution to GDP growth (Chart 3). Although net trade was negative in the headline figures, it turned positive when volatile Irish trade flows were excluded. The decomposition of value added shows that growth was supported by both services and manufacturing, net of volatile Irish data. By contrast, construction was a drag on growth.
Chart 3
Euro area real GDP and its components
(quarter-on-quarter percentage changes; percentage point contributions)
Sources: Eurostat and ECB calculations.
Notes: The chart also shows GDP excluding Ireland, as Irish data are particularly volatile. However, the subcomponents display the GDP breakdown including Ireland. The latest observations are for the first quarter of 2026.
Available indicators point to a moderate expansion in economic activity in the second quarter, with uneven developments across sectors, notwithstanding headwinds from the conflict in the Middle East.[1] Total market production stood 0.3% above its first-quarter average in April, reflecting stronger activity in intermediate and capital goods production, particularly in high-technology and defence-related industries, as well as in construction and, to a lesser extent, digital services. These gains were partly offset by declines in consumer goods production, reflecting the continued weakness in pharmaceuticals, and by lower consumer services activity, which was adversely affected by higher energy prices and elevated uncertainty related to the conflict in the Middle East. Industrial production data for May broadly corroborated this picture. With regard to surveys, the composite output Purchasing Managers’ Index (PMI) fell marginally into contractionary territory in the second quarter, driven primarily by weakness in the services sector, while recovering somewhat at the end the quarter (Chart 4). Similarly, the European Commission’s Economic Sentiment Indicator rose further in June but remained well below its pre-war level observed in February.
Chart 4
PMI indicators across sectors of the economy
|
a) Manufacturing |
b) Services |
|---|---|
|
(diffusion indices) |
(diffusion indices) |
 |
 |
Source: S&P Global Market Intelligence.
Note: The latest observations are for June 2026.
Forward-looking indicators signal continued moderate growth over the near term. PMI activity expectations and the European Commission’s business expectations index, which both declined sharply after the onset of the war in the Middle East, had partially recovered by the end of the second quarter. This points to some resilience in the euro area economy, supported by a partial reversal of energy prices and further improvements in supplier delivery times. At the same time, these expectations remain below their pre-conflict levels, reflecting elevated uncertainty. Contacts from the ECB’s Corporate Telephone Survey expect continued modest growth in the third quarter, with momentum remaining uneven across sectors (see Box 5). Manufacturing is expected to benefit from sustained demand in high-technology and defence-related industries, but also from reduced competition from Asia (driven by higher costs or temporary supply disruptions), as well as precautionary buying ahead of expected price rises. By contrast, services are expected to grow at a slower pace, weighed down by subdued consumer services as travel-related activity continues to be affected by geopolitical uncertainty.
The unemployment rate remains low, but job creation has slowed and labour demand continues to soften. The unemployment rate stood at 6.2% in May, having remained broadly stable at this level since mid-2024 (Chart 5). In the first quarter of 2026 employment continued to grow, quarter on quarter, supported by an expanding labour force, while total hours worked decreased by 0.2%. The pace of job creation moderated further to 0.1%, quarter on quarter, and 0.4%, year on year, at the beginning of 2026, following increases of 0.8% in 2025, 1.0% in 2024 and 1.5% in 2023. The gradual moderation in employment growth partly reflects a continued softening in labour demand. The job vacancy rate has been on a downward trend since the second half of 2022. After edging up slightly to 2.3% at the end of 2025, driven by developments in the construction sector, it declined again to 2.2% in the first quarter of 2026. Sectoral trends have diverged over the past year, with vacancies in construction rising, while vacancies in market services and industry have continued to decline.
Chart 5
Euro area employment, PMI assessment of employment and unemployment rate
(left-hand scale: quarter-on-quarter percentage changes, diffusion index; right-hand scale: percentages of the labour force)
Sources: Eurostat, S&P Global Market Intelligence and ECB calculations.
Notes: The two lines indicate monthly developments, while the bars show quarterly data. The PMI is expressed in terms of the deviation from 50, then divided by 10 to gauge quarter-on-quarter employment growth. The latest observations are for the first quarter of 2026 for euro area employment, June 2026 for the PMI assessment of employment and May 2026 for the unemployment rate.
Short-term labour market indicators suggest weak employment momentum in the second quarter of 2026. The monthly composite PMI for employment fell below the neutral threshold of 50 at the beginning of the year. The index showed signs of recovery in June, edging up to 49.9 from 49.0 in May, suggesting that employment was broadly unchanged in the second quarter of the year. The PMI for employment in the services sector returned to expansionary territory in June 2026, reaching 50.4, while the PMI for employment in the manufacturing sector remained firmly in the contractionary territory at 48.2. After increasing strongly following the outbreak of the war in the Middle East, one-year-ahead unemployment expectations reported by respondents to the Consumer Expectations Survey and the European Commission (DG ECFIN) business and consumer surveys stabilised at elevated levels in June.
Private consumption likely slowed further in the second quarter, after growing by 0.3%, quarter on quarter, in the first quarter of the year. Retail trade volumes expanded by 0.2%, quarter on quarter (on average for April-May), with declining fuel sales broadly offset by improvements in other components, especially food (Chart 6). Developments across consumer services production were mixed. Accommodation and food services production declined in April compared with the first quarter, while production increased in air transport and travel. High-frequency indicators point to subdued consumption growth in the third quarter as the economic effects of the war in the Middle East continue to unfold. Consumer uncertainty declined further in June. The European Commission’s consumer confidence indicator continued to improve in June, although it remained well below its February reading. The European Commission’s consumer-weighted expected activity indicator also improved in June but remained below both its long-term average and the February reading. Elevated energy prices and the uncertainty triggered by the war in the Middle East are likely to continue weighing on private consumption in the quarters ahead. While the Memorandum of Understanding (MoU) drawn up between the United States and Iran initially raised the prospect of a lasting reversal in oil prices, subsequent developments have made such an outcome less likely, pointing to higher energy prices being a more persistent drag on purchasing power and household spending. The impact is expected to be cushioned to some extent by robust household balance sheets. However, lower-income households remain particularly exposed, as they spend a larger share of their budgets on energy while having more limited ability to smooth consumption (see Box 3). At the same time, elevated uncertainty appears to be restraining consumption through its effects on consumer confidence. So far, the decline in sentiment has primarily led higher-income households to cut back on discretionary spending (see Box 2).
Chart 6
Private consumption and high-frequency indicators
(private consumption and retail sales: quarter-on-quarter percentage changes; consumer confidence and expected activity: standardised percentage balances)
Sources: Eurostat, European Commission and ECB calculations.
Notes: “Consumer expected activity” refers to a weighted average of business expectations for the next three months with regard to production for manufacturing, employment for construction, business for trade and demand for services from the European Commission business survey, weighted according to the sectoral shares in euro area private consumption from the FIGARO input-output tables for 2023. All series are standardised for the whole sample from January 1999. The latest observations are for the first quarter of 2026 for private consumption, the second quarter of 2026 (based on April-May 2026) for retail sales and June 2026 for all other items.
Business investment is expected to have softened in the second quarter of 2026, amid higher energy prices and elevated uncertainty. Following a period of robust growth in the second half of 2025, euro area non-construction investment (excluding volatile Irish intellectual property products) increased by 0.6%, quarter on quarter, in the first quarter of the year, marking a moderation in investment momentum (Chart 7, panel a). Incoming information for the second quarter presents a mixed picture. On the one hand, industrial production of capital goods rose by 1.1%, quarter on quarter, in April and May, likely reflecting some frontloading of investment spending, as also suggested by respondents to the July round of the Corporate Telephone Survey. On the other hand, PMI indicators for capital goods output and new business remained in contractionary territory in June (at 49.8 for output and 49.7 for new business) pointing to continued weakness in investment in tangible assets, such as machinery and equipment. Looking ahead, rising financing costs and continued geopolitical uncertainty are also likely to weigh on investment in physical capital over the coming quarters. By contrast, available evidence suggests that investment in intangible assets may remain more resilient. Evidence from the Survey on the Access to Finance of Enterprises (SAFE) shows that, up until now, the conflict in Middle East has had a limited impact on firms’ expectations for investment in the next 12 months. In addition, Corporate Telephone Survey respondents identified AI-related technologies as a key driver of current and planned investment, while also reporting renewed investment interest in renewable energy and electrification triggered by the war. Consistent with evidence that uncertainty tends to weigh more heavily on investment in physical capital than on intangible assets, owing to their different financing structures and adjustment costs, intangible investment appears to be less vulnerable to the current environment of heightened uncertainty.[2]
Chart 7
Real investment dynamics and survey data
a) Business investment
(quarter-on-quarter percentage changes; percentage balances)

b) Housing investment
(quarter-on-quarter percentage changes; percentage balances and diffusion index)
Sources: Eurostat, European Commission, S&P Global Market Intelligence and ECB calculations.
Notes: The lines indicate monthly developments, while the bars refer to quarterly data. The PMIs are expressed in terms of the deviation from 50. In panel a), business investment is measured by non-construction investment excluding Irish intangibles. For the confidence indicators, “tangibles” refers to the capital goods sector (the producers of tangible machinery and equipment) and “intangibles” is a weighted average of the subsectors supplying investment related to intellectual property products, i.e. publishing activities (NACE J58); computer programming and consultancy (NACE J62); and information activities (NACE J63). In panel b), the line for the European Commission activity trend indicator refers to the weighted average assessment of the building and specialised construction sectors of the trend in activity over the preceding three months, rescaled to have the same standard deviation as the PMI. The line for PMI output refers to housing activity. The latest observations are for the first quarter of 2026 for investment and June 2026 for PMI output and the European Commission indicators.
Housing investment is expected to have resumed a recovery path in the second quarter of 2026, following the sharp decline in the first quarter. Housing investment fell by 1.7%, quarter on quarter, in the first quarter (Chart 7, panel b), partly owing to adverse weather conditions. At the same time, persistently high construction costs continued to weigh on residential building activity. Following the outbreak of the conflict in the Middle East, input prices and selling price expectations for energy-intensive construction inputs, such as cement and concrete, increased further from already high levels. After the signing of the US-Iran MoU, sentiment started to normalise in June. Consistent with this, the European Commission’s indicator of recent trends in building and specialised construction activity moved back to positive levels. In addition, the order books of construction firms improved in line with an increasing number of building permits in the first quarter of 2026, pointing to robust underlying demand. Taken together, these supportive demand conditions suggest that housing investment is continuing its gradual recovery following the dip in the first quarter, notwithstanding persistent cost pressures and still-muted activity indicators.
The recent improvement in extra-euro area exports appears to be fragile, with leading indicators signalling renewed weakness and rising import price pressures ahead. The volume of extra-euro area goods exports increased by 1.8% in the three months to April compared with the preceding three-month period, while import volumes rose by 0.3%. However, the rise in exports largely reflects a base effect following particularly weak exports at the end of 2025 and does not yet point to a broad-based strengthening in export momentum. Looking ahead, short-term indicators suggest renewed weakness. PMI indicators remained in contractionary territory in May and June, with a more pronounced weakness in services than in manufacturing. Exports continue to be supported by precautionary stock-building, amid concerns over supply availability and price pressures. The decline in euro area import prices, which started in April 2025 and was broad-based across trading partners, appears to have come to an end, largely on account of higher energy prices. Import price pressures are expected to broaden in the period ahead, partly driven by rising Chinese import prices, although those prices still remain below their levels at the end of 2024.
The euro area outlook remains highly uncertain owing to ongoing geopolitical tensions and heightened oil price volatility. A prolonged disruption to energy supplies could keep oil prices higher for longer, eroding real incomes further and raising production costs, weighing on consumption and investment. Intensified trade disruptions could further weaken growth. Russia’s war against Ukraine remains another major source of uncertainty. Conversely, growth could turn out stronger than expected if energy markets adjust more quickly than currently expected. Planned increases in defence and infrastructure spending, reforms to enhance productivity and complete the Single Market, as well as euro area firms adopting new technologies, could also provide additional support to economic activity.
3 Prices and costs
Annual euro area headline inflation declined to 2.8% in June 2026, from 3.2% in May, owing to decreases in all components. While developments in underlying inflation have remained contained, the full effects of the energy shock have yet to play out. Annual growth in compensation per employee decreased to 3.5% in the first quarter of 2026, from 3.8% the quarter before. Negotiated wage growth and forward-looking indicators, such as the ECB’s wage tracker and surveys on wage expectations, continue to indicate moderate wage growth over the coming quarters. Inflation expectations remain at elevated levels over shorter horizons. Most measures of longer-term inflation expectations stand at around 2%, supporting the stabilisation of inflation around target in the medium term.
Annual euro area headline inflation, as measured by the Harmonised Index of Consumer Prices (HICP), decreased to 2.8% in June 2026, from 3.2% in May (Chart 8). This reflects a sharp decline in energy inflation as well as decreases in food inflation and HICP inflation excluding energy and food (HICPX). In the second quarter of 2026 euro area headline inflation stood at 3.0%, 0.2 percentage points below the June 2026 Eurosystem staff macroeconomic projections for the euro area.
Chart 8
Headline inflation and its main components
(annual percentage changes; percentage point contributions)
Sources: Eurostat and ECB calculations.
Notes: “Goods” refers to non-energy industrial goods. HICPX stands for HICP excluding energy and food. The latest observations are for June 2026.
Energy inflation fell noticeably in June, to 8.5% from 10.8% in May. The decline reflects mainly a month-on-month decrease in energy prices (1.8%). This was driven by falling transport fuel prices, amid lower oil prices linked to the improved prospects for a resolution of the war in the Middle East observed in June. The decrease in the annual growth rate of transport fuel prices was only partially offset by an increase in the annual growth rate of gas and electricity prices. HICP inflation excluding energy also edged down, from 2.4% in May to 2.2% in June.
Food inflation decreased to 1.5% in June from 1.9% in May. This encompasses a decline in both unprocessed food inflation and processed food inflation. Unprocessed food inflation dropped to 3.1% in June from 4.0% in May, while processed food inflation decreased to 0.9% from 1.1% over the same period. Overall, the indirect effects of the recent energy price shock on food inflation appear to be limited thus far. Instead, current adverse weather conditions – summer heatwaves and the developing El Niño (a recurring climate pattern that alters weather around the world, increasing the likelihood of floods, droughts and heatwaves) – may pose upside risks to the inflation outlook.
HICPX inflation moderated to 2.4% in June from 2.6% in May. This reflects lower rates of services inflation (3.2% in June, down from 3.5% in May) and non-energy industrial goods (NEIG) inflation (0.7% in June, down from 0.9% in May). The decline in services inflation was mainly driven by a decrease in transport services and recreation services, owing to the easing of price dynamics in June following the surge in jet fuel prices as well as the boost to tourism in May due to the higher number of public holidays. The subdued rate of NEIG inflation in June mainly reflects a strong decrease in the inflation of semi-durable and, to a lesser extent, durable goods.
Almost all underlying inflation indicators declined in June compared with the previous month (Chart 9). These indicators ranged between 2.1% and 2.5% in June. Most exclusion-based measures decreased by between 0.1 and 0.2 percentage points, except for HICP excluding energy and food, travel-related items, clothing and footwear (HICPXX), which was unchanged at 2.4%, and the weighted median, which ticked up. Regarding model-based indicators, the Persistent and Common Component of Inflation decreased to 2.1% in June, from 2.3% in May, while the Supercore indicator, which comprises HICP items sensitive to the business cycle, edged down to 2.5% from 2.6%. Domestic inflation, which comprises items with a low import content, also eased in June, to 3.2% from 3.4% in May. Overall, the latest readings of underlying inflation measures point to broadly stabilising underlying price pressures.
Chart 9
Indicators of underlying inflation
(annual percentage changes)
Sources: Eurostat and ECB calculations.
Notes: HICPX stands for HICP excluding energy and food; HICPXX stands for HICPX excluding travel-related items, clothing and footwear; PCCI stands for the Persistent and Common Component of Inflation. The grey dashed line represents the Governing Council’s inflation target of 2% over the medium term. The latest observations are for June 2026.
Pipeline pressures increased further at the early stages of the pricing chain but are still contained at the later stages (Chart 10). At the early stages of the pricing chain, energy producer price inflation increased by 1.5 percentage points in May, reaching 14.0% year on year. Similarly, energy import price inflation rose by 8.5 percentage points to 41.6% year on year. Despite being substantial, these increases were smaller than those recorded in April, when energy producer and import price inflation rose by 8.5 and 25.8 percentage points respectively. Regarding intermediate goods, both domestic producer price inflation and import price inflation increased in May, to 5.5% and 7.4% respectively. At the later stages of the pricing chain, pipeline pressures for non-food consumer goods showed little change, with domestic producer price inflation edging up to 2.1% and import price inflation remaining negative at ‑1.2%. Manufactured food producer price inflation also remained in negative territory (‑1.0%), as did import price inflation for manufactured food, which stood at ‑2.6% in May. As the latest available data predate the June 2026 US-Iran Memorandum of Understanding and the subsequent reescalation of the conflict, developments in producer and import prices remain subject to high uncertainty.
Chart 10
Indicators of pipeline pressures
(annual percentage changes)
Sources: Eurostat and ECB calculations.
Note: The latest observations are for May 2026.
Domestic cost pressures, as measured by growth in the GDP deflator, decreased to 2.4% (2.5% when excluding volatile Irish data) in the first quarter of 2026 (Chart 11). The decline in the GDP deflator reflects a lower contribution from unit profits, only partially offset by higher contributions from unit labour costs, while contributions from unit taxes were unchanged. Unit labour costs increased by 3.6% in the first quarter of 2026, up from 3.4% in the fourth quarter of 2025. This reflects a fall in the annual growth rate of labour productivity, which turned negative (from 0.3% to ‑0.1%), mitigated somewhat by a decline in the annual growth rate of compensation per employee (from 3.8% to 3.5%). The decline in the annual growth rate of compensation per employee stemmed from a drop in negotiated wage growth, to 2.5% in the first quarter of 2026 from 2.9% in the fourth quarter of 2025, while the wage drift component increased to 1.5 percentage points, from 1.3 percentage points over the same period. Excluding the volatile Irish data, however, the unit profits contribution remained unchanged while that of unit labour costs decreased (to 1.7% from 2.0%). Unit labour costs growth excluding Irish data declined (to 2.9% from 3.4%) on the back of a small increase in labour productivity growth (to 0.5% from 0.4%) and a decrease in compensation per employee (to 3.4% from 3.8%). Looking ahead, the ECB wage tracker, which has been updated with data on wage agreements negotiated up to first week of July 2026, indicates broadly stable negotiated wage pressures of 2.6% in 2026 and 2.7% in the first quarter of 2027.[3] Other survey indicators point to a moderation of wage growth; in the ECB’s Corporate Telephone Survey respondents expected wage growth to slow from 3.1% in 2025 to 2.5% in 2026 and 2.4% in 2027.[4]
Chart 11
Breakdown of the GDP deflator
(annual percentage changes; percentage point contributions)
Sources: Eurostat and ECB calculations.
Notes: Compensation per employee contributes positively to changes in unit labour costs. Labour productivity contributes negatively. The latest observations are for the first quarter of 2026.
Most shorter-term inflation expectations among professional forecasters, monetary analysts and consumers decreased in June 2026, while longer-term survey-based inflation expectations remained unchanged. Short-term inflation expectations for 2026 stood at 2.7% in both the July 2026 ECB Survey of Monetary Analysts (SMA), down from 2.9% in the June 2026 SMA, and the third quarter of 2026 ECB Survey of Professional Forecasters (SPF), unchanged from the second quarter of 2026. The SMA and the SPF point towards a further decline in 2027, to 2.2% (Chart 12, panel a). Regarding short-term consumer inflation perceptions and expectations, the median rate of perceived inflation over the previous 12 months eased to 3.6% in the June 2026 ECB Consumer Expectations Survey (Chart 12, panel b) from 4.0% in May. Median expectations for inflation one year ahead and three years ahead declined to 3.0% and 2.8% respectively, from 3.5% and 2.9% in May. Median expectations for inflation five years ahead remained unchanged at 2.4%. Moving to the longer-term inflation expectations, the median rates in the SMA and the SPF were unchanged at 2% (Chart 12, panel a).
Chart 12
Headline inflation, inflation projections and expectations
a) Headline inflation, market-based measures of inflation compensation, inflation projections and survey-based indicators of inflation expectations
(annual percentage changes)

b) Headline inflation and ECB Consumer Expectations Survey
(annual percentage changes)
Sources: Eurostat, LSEG, Consensus Economics, ECB (SMA, SPF, CES), Eurosystem staff macroeconomic projections for the euro area, June 2026 and ECB calculations.
Notes: In panel a), the market-based measures of inflation compensation series is based on the one-year spot inflation-linked swap rate, the one-year forward rate one year ahead, the one-year forward rate two years ahead, the one-year forward rate three years ahead and the one-year forward rate four years ahead. The latest observations for the market-based measures of inflation compensation series and for fixings are for 22 July 2026. Inflation fixings are swap contracts linked to specific monthly releases of euro area year-on-year HICP inflation excluding tobacco. The SMA for July 2026 was conducted between 6 and 8 July 2026. The SPF for the third quarter of 2026 was conducted between 1 and 6 July 2026. The cut-off date for the Consensus Economics forecasts was 13 July 2026. The June 2026 Eurosystem staff macroeconomic projections for the euro area were finalised on 27 May 2026, and the cut-off date for the technical assumptions was 21 May 2026. In panel b), the lines for the Consumer Expectations Survey (CES) represent the median rates. The latest observations are for June 2026.
Over the review period from 11 June to 22 July, near-term market-based measures of inflation compensation decreased, while longer-term market-based expectations remained well anchored (Chart 12, panel a). Energy prices fluctuated amid developments of the conflict in the Middle East, leading to volatility in the pricing of the inflation outlook. Inflation fixings, which are swap contracts linked to the euro area HICP excluding tobacco, decreased in the short horizon, although they still indicate that investors expect inflation to remain elevated over the coming year before easing to levels close to the ECB’s 2% inflation target by mid-2027. Looking beyond the near term, the one-year forward inflation-linked swap rate one year ahead increased by 8 basis points to stand at around 2.28% at the end of the review period. When adjusted for inflation risk premia, however, the same measure declined by 3 basis points to stand at 1.99% at the end of the review period. Longer-term market-based inflation expectations, as reflected in the five-year forward inflation-linked swap rate five years ahead, remained firmly anchored at around 2.0% once adjusted for inflation risk premia.
4 Financial market developments
Over the review period from 11 June to 22 July 2026, euro area financial markets responded positively to the Memorandum of Understanding (MoU) agreed between the United States and Iran, before going into reverse as tensions between the two countries re-escalated. The rate hike announced by the Governing Council on 11 June was well anticipated and fully transmitted through money markets and broader capital markets. At the end of the review period, the euro short-term rate (€STR) forward curve was pricing in around 40 basis points of cumulative policy rate hikes by the end of 2026, which is similar to the level priced in at the start of the review period. Long-term interest rates and sovereign bond yields were unchanged overall, leaving real forward rates and sovereign bond spreads over risk-free rates broadly stable as well. Broad stock market indices in the euro area moved up over the review period on account of a positive long-term earnings outlook, although swings in sentiment towards artificial intelligence (AI) triggered some intra-period volatility. Corporate bond spreads narrowed slightly in both the investment-grade and high-yield segments. In foreign exchange markets, the euro depreciated slightly against the US dollar (‑1.1%) and was largely stable in trade-weighted terms (‑0.4%).
Euro area short-term risk-free rates increased over the review period, while longer-term risk-free rates remained broadly unchanged. Following the Governing Council’s decision at its meeting on 11 June 2026 to raise the three key ECB interest rates by 25 basis points, the benchmark €STR stood at 2.2% at the end of the review period. Excess liquidity decreased by around €55 billion to €2,161 billion, which mainly reflected the continuing decline in the portfolios of securities held for monetary policy purposes. Having fallen between the April and June Governing Council meetings as tensions in the Middle East eased, near-term forward rates continued to fall following the signing of the MoU between the United States and Iran on 17 June. However, they subsequently started to increase again as hostilities resumed. The €STR forward curve at the end of the review period implied cumulative interest rate hikes of around 40 basis points by the end of 2026, similar to the level priced in at the start of the review period. Looking beyond the end of the year, €STR forward rates at the end of the review period had risen slightly relative to the start of the review period. The ten-year nominal overnight index swap (OIS) rate increased by 12 basis points over the review period, to stand at 3.0%.
Overall, euro area long-term sovereign bond yields rose slightly over the review period, with little change in spreads relative to risk-free rates (Chart 13). The ten-year GDP-weighted euro area sovereign bond yield increased by 18 basis points, closing the review period at around 3.6%. Ten-year sovereign yields across the euro area largely tracked the risk-free OIS rate, and cross-country dispersion in sovereign spreads over risk-free rates remained at historically low levels despite the uncertain environment. The ten-year US Treasury yield increased by around 20 basis points, to stand at 4.7%. Ten-year UK gilt yields fluctuated somewhat over the review period and ended around 5 basis points higher, at 5.0%.
Chart 13
Ten-year sovereign bond yields and the ten-year OIS rate based on the €STR
(percentages per annum)
Sources: LSEG and ECB calculations.
Notes: The vertical grey line denotes the start of the review period on 11 June 2026. The latest observations are for 22 July 2026.
Broad stock market indices in the euro area gained over the review period on account of a positive earnings outlook, but there was some intra-period volatility due to swings in sentiment towards AI. Overall, euro area stock markets rose by 3.3% over the review period, with the sub-index for non-financial corporations (NFCs) increasing by 0.4% and bank stock prices moving up by 14.7%. Bank stocks received a boost from the Governing Council’s policy rate increase on 11 June and were subsequently supported by tailwinds from the US-Iran MoU and strong second-quarter earnings reports from US banks on the back of buoyant trading activity. In the United States, the broad equity market index went up by 1.4%, with NFCs and banks posting increases of 0.7% and 8.1% respectively. Apart from the macroeconomic effects related to more favourable near-term inflation and monetary policy expectations, the main driver of stock market volatility on both sides of the Atlantic was sentiment towards AI. Since the potential payout of AI is far in the future, market commentaries increasingly point to the speculative risks associated with massive AI investments.
In corporate bond markets, euro area investment-grade and high-yield spreads narrowed over the review period, returning to their pre-war levels. This compression in euro area corporate spreads reflected an improvement in risk appetite following the deterioration triggered by the outbreak of the war in the Middle East. The narrowing was most pronounced in the high-yield segment, where spreads tightened by around 20 basis points. Investment-grade spreads declined by approximately 2 and 3 basis points for NFCs and financial firms respectively.
In foreign exchange markets, the euro depreciated against the US dollar but was more stable in trade-weighted terms (Chart 14). The nominal effective exchange rate of the euro – as measured against the currencies of 40 of the euro area’s most important trading partners – was largely stable over the review period (‑0.4%) but remained below pre-war levels. This relative stability reflected broadly counterbalancing movements against several of these currencies. The euro weakened against both the US dollar (‑1.1%) and Chinese renminbi (‑1.2%). The strength of the US dollar was underpinned primarily by a shift in market expectations towards a tightening of monetary policy by the Federal Reserve System, combined with resilient macroeconomic data in the United States. The euro also lost ground against the pound sterling (‑1.1%), the South Korean won (‑4.3%) and the Brazilian real (‑2.7%). By contrast, the euro appreciated against the Polish zloty (+1.8%) and the Hungarian forint (+2.5%).
Chart 14
Changes in the exchange rate of the euro vis-à-vis selected currencies
(percentage changes)
Source: ECB calculations.
Notes: EER-40 is the nominal effective exchange rate of the euro against the currencies of 40 of the euro area’s most important trading partners. A positive (negative) change corresponds to an appreciation (depreciation) of the euro. All changes have been calculated using the foreign exchange rates prevailing on 22 July 2026.
5 Financing conditions and credit developments
Bank lending rates for firms remained unchanged in May, at 3.6%, while mortgage rates rose to 3.5%. Over the review period from 11 June to 22 July 2026, both the cost to non-financial corporations of market-based debt and the cost of equity increased, driven by both a rising equity risk premium and higher risk-free long-term rates. Growth in loans to firms increased in May to 4.0%, while growth in loans to households edged up to 3.1%. The annual growth rate of broad money (M3) increased to 3.2%. According to the July 2026 euro area bank lending survey, banks reported a small increase in demand for new loans to firms on the back of a moderate tightening of credit standards in the second quarter of 2026. Demand for housing loans decreased markedly and consumer credit demand fell slightly, while credit standards for household loans tightened. In the Survey on the Access to Finance of Enterprises (SAFE) for the second quarter of 2026, which was conducted between 21 May and 26 June 2026, firms reported an increase in bank interest rates as well as a continued tightening of other lending conditions.
Bank funding costs remained stable in May. The composite cost of debt financing for euro area banks remained unchanged at 1.6% in May (Chart 15). Following the outbreak of the war in the Middle East on 28 February, bank bond yields increased by around 70 basis points, before levelling off by the end of April and continuing to fluctuate at just below 3.5%. The composite deposit rate, which measures the marginal cost of bank deposit funding, remained stable at 0.9% in May. Interest rates on time deposits increased slightly, while rates on overnight deposits, savings accounts and interbank rates were unchanged.
Chart 15
Composite bank funding costs in the euro area
(annual percentages)
Sources: ECB, S&P Dow Jones Indices LLC and/or its affiliates, and ECB calculations.
Notes: The composite cost of debt financing is an average of new business costs for banks for overnight deposits, deposits redeemable at notice, time deposits, bonds and interbank borrowing, weighted by their respective outstanding amounts. The composite cost of deposits is calculated as the average of new business rates on overnight deposits, deposits with an agreed maturity and deposits redeemable at notice, weighted by their respective outstanding amounts. The latest observations are for May 2026 for the composite cost of debt financing and the composite cost of deposits, and 22 July 2026 for bank bond yields.
Bank lending rates for firms remained stable in May, while those for households increased slightly (Chart 16). The cost of bank borrowing for non-financial corporations was broadly unchanged at 3.6% in May, around 160 basis points below its October 2023 peak. Rate increases were observed for loans with medium-term fixation periods (between one and five years), whereas rates for loans with other fixation periods remained unchanged. The spread between interest rates on small and large loans to firms widened somewhat further by 11 basis points, driven by higher rates on small loans, although the widening remained contained by historical standards. The cost of borrowing for households for house purchase edged up to 3.5% in May, from 3.4% in April, still around 60 basis points below its November 2023 peak. The increase reflects a modest increase in rates for short-term and medium-term loans, while those for loans with longer maturities were stable.
Chart 16
Composite bank lending rates for firms and households in the euro area
(annual percentages)
Sources: ECB and ECB calculations.
Notes: Composite bank lending rates are calculated by aggregating short and long-term rates using a 24-month moving average of new business volumes. The latest observations are for May 2026.
Over the review period from 11 June to 22 July 2026, both the cost of market-based debt issued by firms and the cost of equity financing increased. The overall cost of financing for non-financial corporations – the composite cost of bank borrowing, market-based debt and equity – remained at 6.2% in May 2026 for the third consecutive month (Chart 17).[5] The slight decline in the cost of both equity and marked-based debt financing was compensated by an increase in the cost of long-term bank borrowing. Over the review period as a whole, the cost of market-based debt increased owing to higher risk-free rates, which were only partly compensated by a small decline in corporate bond spreads, especially in the high-yield segment (see Section 4, “Financial market developments”). The cost of equity financing also increased over the review period, which was primarily attributable to a higher equity risk premium, followed by rising long-term risk-free rates.
Chart 17
Nominal cost of external financing for euro area firms, broken down by component
(annual percentages)
Sources: ECB, Eurostat, Dealogic, Merrill Lynch, Bloomberg Finance L.P., LSEG and ECB calculations.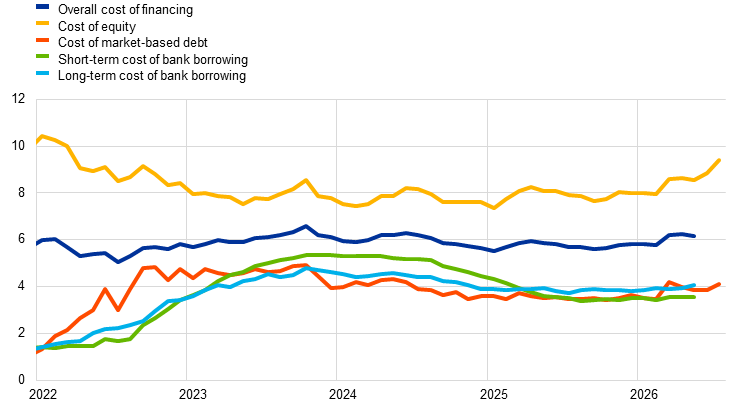
Notes: The overall cost of financing for non-financial corporations is based on monthly data and is calculated as an average of the short and long-term costs of bank borrowing (monthly average data) and the costs of market-based debt and equity (end-of-month data), weighted by their respective outstanding amounts. The latest observations are for 22 July 2026 for the cost of market-based debt and the cost of equity (daily data), and May 2026 for the overall cost of financing and the short and long-term cost of borrowing from banks (monthly data).
Growth in loans to firms increased in May, partly offset by slower growth in corporate bond issuance, while growth in loans to households edged up slightly (Chart 18). The annual growth rate of bank lending to non-financial firms increased to 4.0% in May, from 3.4% in April, still below its historical average of 4.3% since the start of 1999. The annual growth rate of external debt financing by firms rose to 3.9% in May, up from 3.7% in April, reflecting weaker growth in the net issuance of corporate bonds, which fell from 4.5% to 3.4%. Loan growth was particularly strong at longer maturities. The annual growth rate of loans to households increased slightly to 3.1% in May, up from 3.0% in April, also remaining below its historical average of 4.1% since the start of 1999. Although robust growth in consumer credit and mortgage lending continued, monthly flows for loans to households in May were weaker than in the previous months. Growth in other forms of lending to households, including loans to sole proprietors, remained subdued historically. According to the latest ECB Consumer Expectations Survey for May 2026, the war in the Middle East has adversely affected household expectations regarding credit access.
Chart 18
MFI loans in the euro area
(annual percentage changes)
Sources: ECB and ECB calculations.
Notes: Loans from monetary financial institutions (MFIs) are adjusted for loan sales and securitisation; in the case of non-financial corporations, loans are also adjusted for notional cash pooling. The latest observations are for May 2026.
The July 2026 euro area bank lending survey, conducted between 15 and 30 June 2026, reports a further moderate tightening of credit standards for loans to firms and a further tightening of credit standards for housing loans in the second quarter of 2026 (Chart 19). The tightening of credit standards for loans or credit lines to euro area firms was less than in the first quarter and considerably smaller than previously expected by banks. Higher perceived risks to the economic outlook and lower risk tolerance on the part of banks remained the main contributing factors. The conflict between the United States and Iran remains a source of uncertainty, with banks revising their assessments as events unfold. Responses to a dedicated open-ended question show that banks remain highly attentive to risks and are continuing to closely monitor credit risks, especially in the most exposed sectors, with some reporting an additional tightening of credit standards related to geopolitical tensions and energy developments in the second quarter. Banks reported a net tightening of credit standards for both housing loans and consumer credit, with lower risk tolerance and higher risk perceptions having been the main drivers. For the third quarter of 2026, euro area banks expect credit standards to tighten at a more moderate pace for loans to firms, tighten mildly for housing loans and tighten more strongly for consumer credit.
Chart 19
Changes in credit standards and net demand for loans to NFCs and loans to households for house purchase
(net percentages of banks reporting a tightening of credit standards or an increase in loan demand)
Source: ECB (bank lending survey).
Notes: NFCs stands for non-financial corporations. For survey questions on credit standards, “net percentages” are defined as the difference between the sum of the percentages of banks responding “tightened considerably” and “tightened somewhat” and the sum of the percentages of banks responding “eased somewhat” and “eased considerably”. For survey questions on demand for loans, “net percentages” are defined as the difference between the sum of the percentages of banks responding “increased considerably” and “increased somewhat” and the sum of the percentages of banks responding “decreased somewhat” and “decreased considerably”. The diamonds denote expectations reported by banks in the current round. The latest observations are for the second quarter of 2026.
Banks reported a small increase in the demand for loans to firms, while demand for housing loans decreased markedly and demand for consumer credit decreased slightly in the second quarter of 2026. The rise in demand for loans to firms was unexpected, in that banks in the previous survey round had anticipated a more pronounced decrease. Higher loan demand was supported by higher demand for inventories and working capital, demand for fixed investment from large firms and other financing needs related to debt financing and restructuring. Demand for housing loans decreased markedly, whereas demand for consumer credit decreased slightly. Deteriorating consumer confidence and developments in interest rates were the main drag on housing loan demand, followed by worsening housing market prospects. Other factors related to the promotion of attractive lending conditions and better access to mortgage applications via digital channels had a small positive effect. Changes in housing loan demand were contained but more substantial than banks had expected. Demand for consumer credit continued to soften, reflecting lower consumer confidence and weaker spending on durable goods, as well as a small negative contribution from the general level of interest rates. For the third quarter of 2026, banks expect a moderate net increase in demand for loans to firms and further declines in demand for housing loans, while demand for consumer credit is expected to remain unchanged.
Banks’ access to funding deteriorated slightly further, while risks to credit quality had a tightening impact on credit standards and those related to climate considerations had an easing impact. According to the responses of banks to the ad hoc questions in the survey, in the second quarter of 2026 the ease with which banks were able to access debt securities, money markets and retail funding deteriorated further, although only slightly, while it remained broadly unchanged for securitisations. Over the next three months, banks expect access to debt securities, retail and money market funding to continue deteriorating, and to remain unchanged for securitisations. Banks reported a net tightening impact of non-performing loan ratios and other credit quality indicators on their credit standards for loans to firms and consumer credit, whereas this had little effect on credit standards for housing loans. Banks indicated that higher risk perceptions and lower risk tolerance and, to a much smaller extent, pressure stemming from supervisory or regulatory requirements and costs related to balance sheet clean-up operations had contributed to the net tightening. Credit standards tightened most in sectors like automotive and energy-intensive manufacturing. For the third quarter of 2026, euro area banks expect credit quality to have a further tightening impact on their credit standards for loans to firms and for consumer credit. Banks reported lower or broadly unchanged loan demand across most economic sectors. For loans to green firms and firms making progress in their green transition, euro area banks reported a net easing impact of climate change on credit standards and a positive impact on loan demand over the past twelve months, compared with a tightening impact on credit standards and a small net decrease in loan demand for high-emitting firms without credible climate transition plans. For buildings with current or targeted good or high energy performance, banks reported a climate-related net easing impact on credit standards and a positive impact on housing loan demand, while indicating tighter credit standards and a negative impact on loan demand for buildings with persistently low energy performance.
In the latest Survey on the Access to Finance of Enterprises (SAFE), conducted between 21 May and 26 June 2026, firms reported a tightening in bank lending conditions amid increases in bank interest rates. In the second quarter of 2026, a net 42% of firms reported an increase in bank interest rates, compared with a net 26% in the previous quarter. Large firms and small and medium-sized enterprises (SMEs) reported similar perceptions regarding the increase in interest rates. Beyond interest rates, firms also faced higher non-interest borrowing costs, although the pace of tightening was reported to have slowed.
Firms reported a small increase in needs for bank loans, with availability perceived as broadly unchanged, though responses diverged between SMEs and large firms (Chart 20). In the second quarter of 2026, a net 2% of firms indicated an increase in needs for bank loans (compared with a net 0% in the previous quarter), while a net 1% of firms reported a decline in bank loan availability (from 3% in the previous quarter). The responses differed by firm size: SMEs reported a further decline in availability, whereas large firms reported an increase. The bank loan financing gap indicator – an index capturing the difference between changes in needs and availability – remained positive for a net 3% of firms (up from a net 2% in the previous quarter), continuing to signal that needs exceed availability. Looking ahead, a net 2% of all firms anticipate a decline in bank loan availability over the next three months, with weaker expectations among those firms significantly affected by the war in the Middle East (a net 9% expected a decline).
Chart 20
Changes in needs of euro area firms for loans, current and expected bank loan availability and financing gap
(net percentages of respondents)
Sources: ECB (SAFE) and ECB calculations.
Notes: SMEs stands for small and medium-sized enterprises. Net percentages are the difference between the percentage of firms reporting an increase in the availability of bank loans (or needs and expected availability respectively) and the percentage reporting a decrease in availability in the past three months. The indicator of the perceived change in the financing gap takes a value of 1 (-1) if the need increases (decreases) and availability decreases (increases). If firms perceive only a one-sided increase (decrease) in the financing gap, the variable is assigned a value of 0.5 (-0.5). A positive value for the indicator points to a widening of the financing gap. Values are multiplied by 100 to obtain weighted net balances in percentages. Expected availability has been shifted forward by one period to allow a direct comparison with realisations. The figures refer to rounds 30 to 39 of the SAFE (January-March 2024 to April-June 2026).
The annual growth rate of broad money (M3) rose in May, amid increased volatility of foreign inflows into the euro area (Chart 21). Annual growth in M3 rebounded to 3.2% in May, from 2.7% in April, returning to the level recorded in March. This rebound was supported by the reversal in net foreign inflows after the large outflow in April. Broad money growth has stayed close to these levels since August 2025, well below its historical average of 5.2% observed since the start of 1999. However, it has exhibited increased volatility in recent months, primarily driven by monthly fluctuations in deposits from non-bank financial intermediaries. The annual growth rate of narrow money (M1) – comprising the most liquid instruments, namely currency in circulation and overnight deposits – increased modestly from 3.8% in April to 4.0% in May, reflecting sizeable deposit flows for all sectors, most notably firms. From a counterpart perspective, domestic credit has played a larger role in money creation since the start of the Middle East war. By contrast, the reduction of the Eurosystem balance sheet continued to weigh on M3 growth.
Chart 21
M3, M1 and overnight deposits
(annual percentage changes, adjusted for seasonal and calendar effects)
Source: ECB.
Note: The latest observations are for May 2026.
1 Europe’s venture capital gap and the financing of high-growth firms
A deeper and more integrated venture capital (VC) market could help the EU finance innovative firms, support productivity growth and retain more value from its innovation ecosystem. This box shows that Europe’s VC challenges reflect gaps in later-stage financing, a relatively narrow institutional investor base and limited cross-border investment within the EU. It also highlights the productivity potential of VC-backed firms, underscoring the case for policy action, in line with the recommendations of the Kukies-Noyer report (2026).
2 Tracing the ripple effects of the Middle East war on euro area consumption
Euro area consumer confidence deteriorated markedly in the months following the outbreak of the war in the Middle East. The consumer confidence index (CCI), which is based on responses to the ECB Consumer Expectations Survey (CES), fell by around 12 index points cumulatively between February and April. This decline was comparable in magnitude to the 15 index point decrease recorded in the first two months following Russia’s invasion of Ukraine. Although the CCI partially rebounded in May and June, increasing by 3.5 index points, a key question that remains is whether the sharp initial fall reflected changes in consumer behaviour or was primarily a sentiment shock, with more limited implications for actual consumption if the shock were to prove temporary.[6] This box addresses this question by linking individual consumer confidence to self-reported nominal consumption across 16 expenditure categories. The analysis distinguishes between necessities and discretionary spending.[7]
3 Feeling the heat unevenly: energy prices and household consumption
The war in the Middle East has led to a sharp rise in real energy prices which is likely to weigh on euro area economic activity. This conflict has once again highlighted; the vulnerability of the euro area to energy price shocks. Brent crude oil prices increased markedly following the outbreak of the war in late February, reflecting disruptions to crude oil supplies through the Strait of Hormuz and a decline in oil production in the Middle East. Being a large net importer of energy, the euro area experiences such a shock as an effective transfer of real income to the rest of the world − an economic burden which is distributed unevenly across households.[8] This box examines the mechanisms behind the aggregate and distributional effects of energy price shocks on euro area household consumption, drawing on a quantitative heterogeneous agent New Keynesian model.
4 Youth employment amidst cooling labour demand
This box analyses the latest trends in the euro area to shed light on the recent deterioration in employment prospects for young workers. Concerns about youth employment have become especially widespread since 2023, following the emergence of generative artificial intelligence (AI). A hypothesis often put forward is that advances in AI are replacing entry-level jobs, limiting job opportunities for young workers. This box explores the extent to which cyclical or more structural factors are at play in the euro area labour market.
5 Main findings from the ECB’s recent contacts with non‑financial companies
This box summarises the main findings from recent contacts between ECB staff and representatives of 76 leading non-financial companies operating in the euro area.[9] The exchanges mainly took place between 22 June and 1 July 2026, i.e. shortly after the signing of the US-Iran Memorandum of Understanding (MoU) in mid-June, which subsequently broke down in early July amid renewed hostilities around the Strait of Hormuz.
Reports from contacts pointed to moderate growth in activity in the second quarter and towards broadly unchanged momentum in the third quarter. While the war in the Middle East and consequent rise in fuel prices had reduced travel and was weighing on consumer spending somewhat, the overall impact on activity seemed quite limited. This was partly because some firms had benefited from reduced competition from Asian competitors (whose costs had increased by more or whose supply had been temporarily disrupted) and precautionary buying in anticipation of higher prices. This had resulted in a shift in the composition of growth towards manufacturing and away from services. However, the global economy had proved resilient and Asian economies remarkably flexible in overcoming disruption caused by the blockage of the Strait of Hormuz, and global trade was now growing robustly again.
6 Capturing inflation expectations (de-)anchoring and what survey-based metrics are telling us
Following the sizeable recent energy price shock, this box re-assesses the anchoring of longer-term inflation expectations – those most relevant to maintaining price stability – focusing on surveys of consumers, firms and professional forecasters.[10],[11] The economic literature on inflation expectations suggests a wide range of indicators to assess whether a long-term anchor is in place (Reis, 2021 and 2026; Neri et al., 2022; Work stream on inflation expectations, 2021). Average or median longer-term inflation expectations consistent with price stability (“level anchoring”) is a key assessment metric. Other metrics may also be informative and possible harbingers of de-anchoring, particularly in the aftermath of a significant shock. For instance, disagreement among agents, uncertainty surrounding longer-term expectations and tail risks (the probability of very low or very high inflation) should be contained (“higher-moment anchoring”). In addition, well-anchored longer-term expectations should not co-move too much with short-term expectations or temporary shocks (“shock anchoring”). Any assessment of anchoring should be holistic rather than focused on a single indicator or class of economic agents and should consider agent characteristics, as the expectations of consumers and firms are typically more dispersed than those of professional forecasters and exhibit a systematic upward bias (which is a global phenomenon).[12]
7 The ECB-BIG index: tracking credit conditions in the euro area
The European Central Bank Broad Intermediation Gauge (ECB-BIG) index is a new indicator that provides a timely assessment of developments in intermediation conditions across banks and non-banks. The ECB-BIG index tracks euro area credit conditions using a broad set of indicators that shed light on credit availability, needs and costs across the economy. It provides a useful summary of credit conditions, particularly when individual indicators appear to give contrasting signals. For example, at the beginning of the global financial crisis, growth in bank loans to households had already begun to slow, while that in bank loans to firms continued to grow at a steady rate in the first few months of 2008 before decelerating sharply (Chart A, panel a). In recent months bank loans have continued to grow at a stable rate, while lending rates have started to increase, suggesting that credit conditions might be tightening (Chart A, panel b). The ECB-BIG index provides the first comprehensive summary of these and other indicators of credit conditions in the euro area.
8 Assessing the scope for compensatory fiscal measures in response to the recent energy shock
The recent global energy shock has affected the economies and public finances of euro area countries, but there are significant differences compared with the 2022 energy crisis.[13] This box first discusses the differences between the fiscal policy conditions prevailing at the onset of the recent energy crisis and those observed following Russia’s invasion of Ukraine in February 2022. It then presents an overview of the discretionary fiscal policy support that euro area governments have provided since the 2026 shock and assesses the scope for self-financing measures.
1 The cost of not knowing: how uncertainty weighs on the euro area economy
Economic uncertainty has increasingly become a defining feature of the macroeconomic environment. The euro area economy has been repeatedly exposed to large and multifaceted shocks in recent years, which have been accompanied by a marked rise in uncertainty along with a discernible softening or even contraction of economic activity. Understanding the role and economic impact of uncertainty is particularly important in the current geopolitical environment.
Morehttps://www.ecb.europa.eu/pub/pdf/ecbu/ecb.eb_annex202605~eb96358d07.en.pdf
© European Central Bank, 2026
Postal address 60640 Frankfurt am Main, Germany
Telephone +49 69 1344 0
Website www.ecb.europa.eu
All rights reserved. Reproduction for educational and non-commercial purposes is permitted provided that the source is acknowledged.
This Bulletin was produced under the responsibility of the Executive Board of the ECB. Translations are prepared and published by the national central banks.
For specific terminology please refer to the ECB glossary (available in English only).
The cut-off date for the statistics included in this issue was 22 July 2026.
PDF ISSN 2363-3417, QB-01-26-055-EN-N
HTML ISSN 2363-3417, QB-01-26-055-EN-Q