
- Gold price holds overnight pullback from record highs and stays below $2,900.
- Trump’s tariffs uncertainty and hawkish Fed Chair Powell’s comments dent Gold price.
- Gold sellers test the key support on the 4H chart, as US CPI inflation data looms.
Gold price consolidates the previous pullback from record highs of $2,943, struggling below $2,900 early Wednesday. All eyes now remain on the high-impact US Consumer Price Index (CPI) data due later in the day for fresh directional impetus in Gold price.
Will US CPI data accentuate Gold price correction?
Markets are battling uncertainty surrounding US President Donald Trump’s plans for reciprocal tariffs and Federal Reserve (Fed) easing trajectory, leaving Gold price in a limbo, with traders cashing in on their long positions heading into the critical US inflation test.
Traders remain on tenterhooks as they remain expectant of Trump’s reciprocal tariffs coming into effect from Wednesday but it is not yet confirmed whether the tariffs will come through later in the day.
When asked if reciprocal tariffs are still coming on Wednesday at an event to welcome home a hostage released by Russian President Vladimir Putin late Tuesday, President Trump said ‘we’ll see’.
Meanwhile, the Wall Street Journal (WSJ) reported that Trump’s team is working on reciprocal tariffs this week via executive action, bypassing Congress.
The speculations around Trump’s tariffs revive the US Dollar’s (USD) as a safe-haven asset, weighing negatively on Gold price. The bright metal also bears the brunt of the hawkish commetary by Fed Chairman Jerome Powell during his Congressional testimony on Wednesday.
Powell hinted that the central bank would maintain its current policy stance, saying that “with the economy remaining strong, we do not need to be in a hurry to adjust our policy stance.”
Markets altered their expectations of Fed interest rate cuts this year to only one in July, fuelling a decent recovery in the US Treasury bond yields at the expense of the non-interest-bearing Gold price.
The next directional move in gold price is on the US CPI release and Trump’s implementation of reciprocal tariffs. The US annual CPI inflation is expected to remain at 2.9% in January while the core figure is seen easing slightly to 3.1%. The monthly headline CPI and core numbers will likely arrive at 0.3% in the same period.
An unexpected increase in the headline CPI could double down on the latest hawkish expectations surrounding the Fed’s policy outlook, driving the USD and the US Treasury bond yields northward while exacerbating the pain in Gold price. Conversely, on a downside surprise, Gold could resume its uptrend on renewed bets of two Fed rate cuts.
However, US President Donald Trump’s tariffs announcement could also remain a key market driver in the sessions ahead.
Gold price technical analysis: Four-hour chart
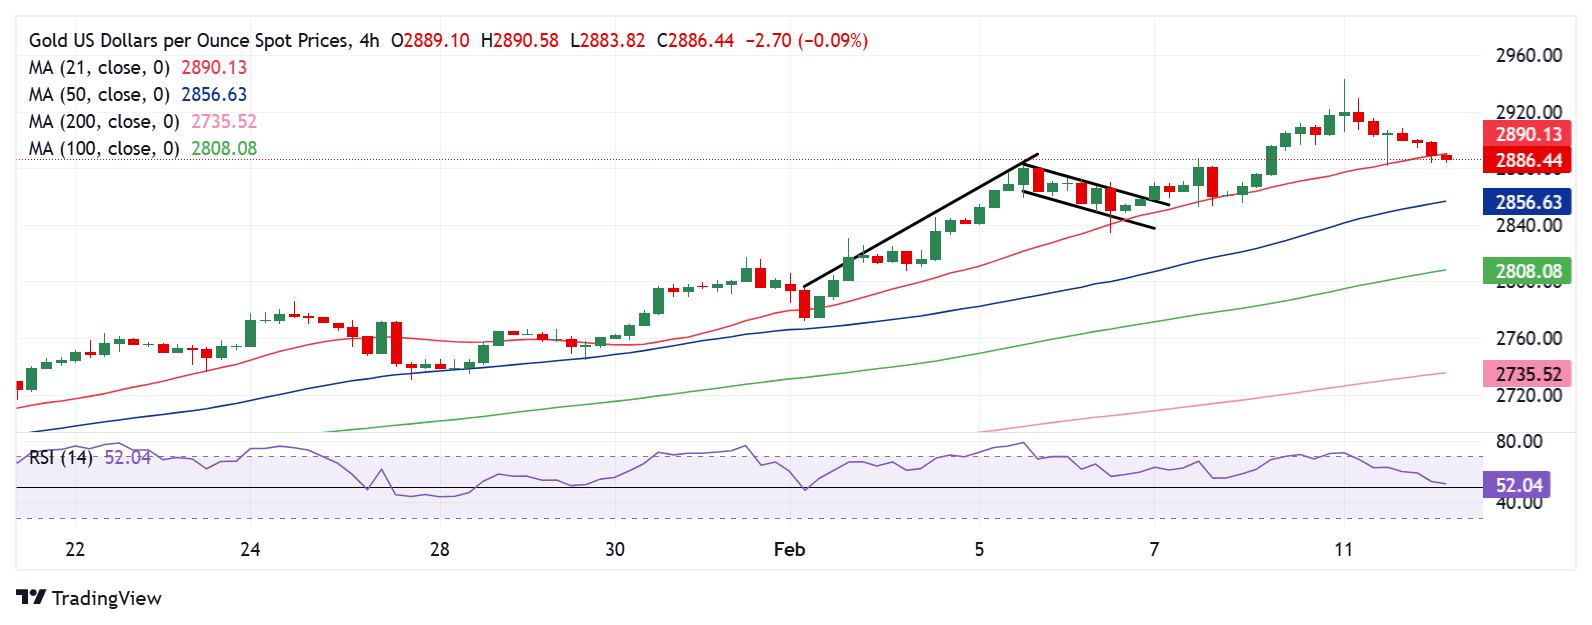
Gold price fell short of the measured target of the Bull Flag on the four-hour chart at $2,962 and pulled back sharply on Tuesday.
Gold sellers remain in control and challenge the critical 21-four hourly Simple Moving Average (SMA) at $2,890.
A four-hourly candlestick closing below that level will provide extra legs to Gold price’s corrective downside, calling for a test of the 50-four hourly SMA at $2,857.
The last line of defense for Gold buyers is the 100-four hourly SMA at $2,808.
The Relative Strength Index (RSI) has turned lower but defends the midline, currently near 52.50, suggesting that the downside could be limited.
Any upswing will need acceptance above the $2,905 static resistance.
If buyers manage to scale the latter decisively, the door will open toward the record high of $2,943.
Gold FAQs
Gold has played a key role in human’s history as it has been widely used as a store of value and medium of exchange. Currently, apart from its shine and usage for jewelry, the precious metal is widely seen as a safe-haven asset, meaning that it is considered a good investment during turbulent times. Gold is also widely seen as a hedge against inflation and against depreciating currencies as it doesn’t rely on any specific issuer or government.
Central banks are the biggest Gold holders. In their aim to support their currencies in turbulent times, central banks tend to diversify their reserves and buy Gold to improve the perceived strength of the economy and the currency. High Gold reserves can be a source of trust for a country’s solvency. Central banks added 1,136 tonnes of Gold worth around $70 billion to their reserves in 2022, according to data from the World Gold Council. This is the highest yearly purchase since records began. Central banks from emerging economies such as China, India and Turkey are quickly increasing their Gold reserves.
Gold has an inverse correlation with the US Dollar and US Treasuries, which are both major reserve and safe-haven assets. When the Dollar depreciates, Gold tends to rise, enabling investors and central banks to diversify their assets in turbulent times. Gold is also inversely correlated with risk assets. A rally in the stock market tends to weaken Gold price, while sell-offs in riskier markets tend to favor the precious metal.
The price can move due to a wide range of factors. Geopolitical instability or fears of a deep recession can quickly make Gold price escalate due to its safe-haven status. As a yield-less asset, Gold tends to rise with lower interest rates, while higher cost of money usually weighs down on the yellow metal. Still, most moves depend on how the US Dollar (USD) behaves as the asset is priced in dollars (XAU/USD). A strong Dollar tends to keep the price of Gold controlled, whereas a weaker Dollar is likely to push Gold prices up.