- The gold price pulls back from the recent multi-week top of $3,366 with a limited downside potential.
- US tariff delays and a weaker dollar continue to benefit the precious metal.
- Traders await key US data and FOMC meeting minutes ahead.
The gold price is now at crossroads due to complex situation stemming from trade uncertainty, future rate cuts, fiscal instability and a weaker US dollar. At the time of writing, the gold price stays around $3,304 after marking lows around $3,295. The precious metal fell from daily highs of $3,341.
–Are you interested in learning more about Canadian forex brokers? Check our detailed guide-
The fundamental factors mentioned above make gold an attractive asset for the investors seeking safety and speculative opportunities. The major catalysts for the gold rally was Moody’s downgrade of US credit outlook that trembled investors’ confidence in US assets. Moreover, the President Trump’s threat to impose 50% tariffs on EU also weakened the dollar and investors fled to gold to seek safety. However, the decision was later deferred until July 09 following talks with European Commission President which eased fears immediately. Hence, the gold pulled back to the fresh weekly lows.
The underlying structural concerns have not disappeared. Trump’s controversial tax bill passed by the House of Representative added more to the fiscal worries of the US as the bill could potentially add $3.8 trillion to the US fiscal deficit. Currently, the federal debt mounts to $36 trillion, weighing heavily on the dollar.
Moreover, the US Treasury yields have hit highs not seen since 2023. Rising yields typically weigh on the non-yielding assets like gold. The US dollar index is also up on the day, partially recovering the Monday’s losses.
However, the gold’s downside could be limited as the geopolitical risks like Israel’s military action in Gaza and Russia’s aerial assault on Ukraine could elevate global uncertainty. Moreover, Trump calling Putin crazy and suggesting new sanctions on Russia may further exacerbate the situation.
Key Events for Gold Today
- US Durable Goods Orders (April)
Gold Price Technical Analysis: $3,292 remains pivot
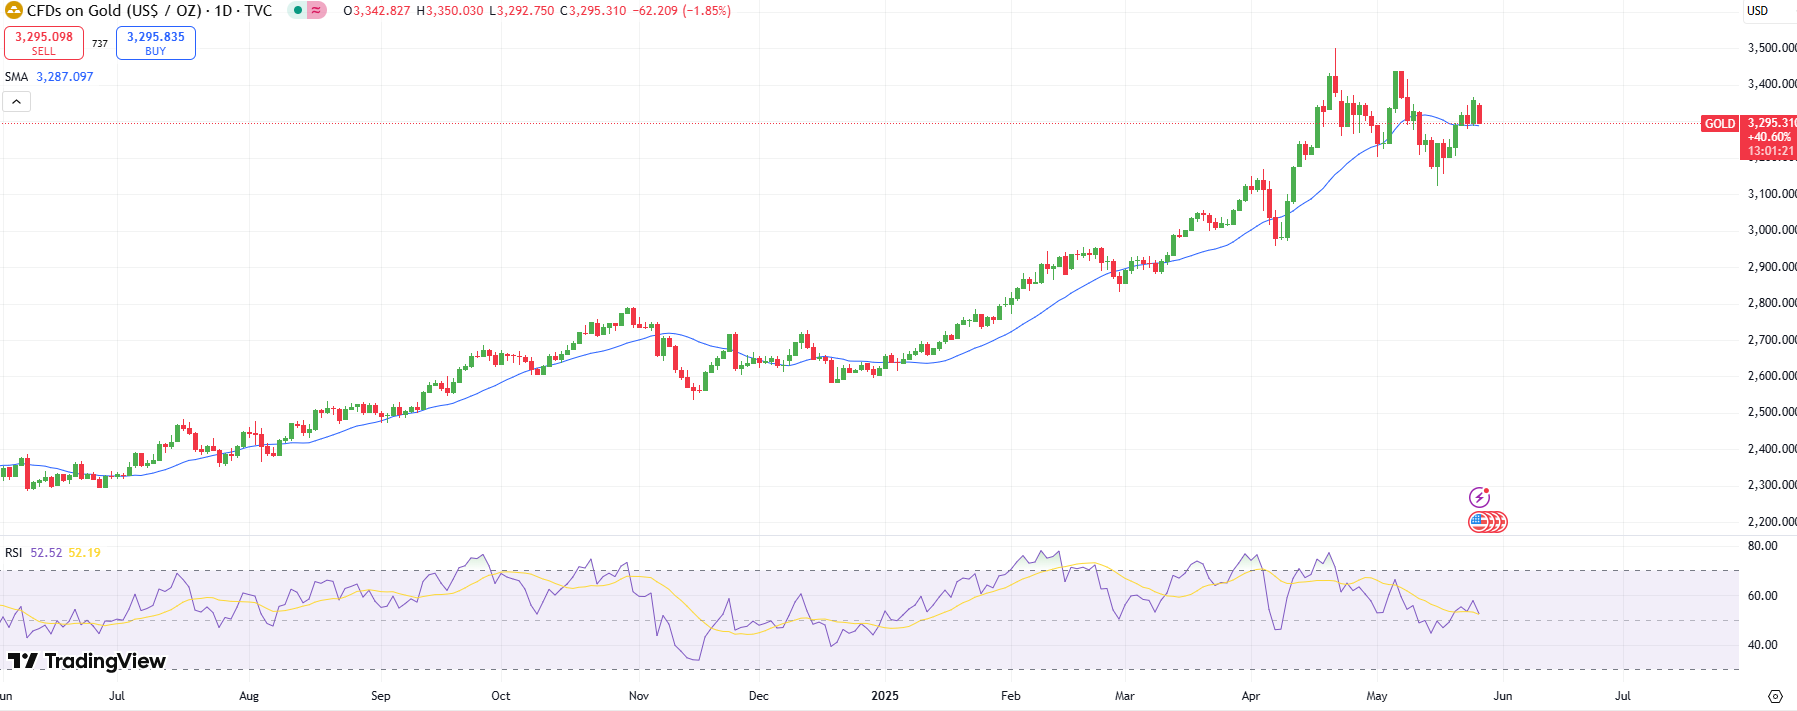
The 4-hour chart for gold reveals a corrective downside, supported by the 20-period SMA and key level of $3,300. Despite the pullback, the broad uptrend remains intact with the next support emerging at $3,292.
–Are you interested in learning more about high leveraged brokers? Check our detailed guide-
Contrarily, if the bulls reclaim the $3,365 resistance zone, the upside can extend to $3,435 with the next target to test all-time highs at $3,500. However, failure to hold the $3,292 level may trigger a deeper correction. However, the dip buying will remain attractive for the investors.
Looking to trade forex now? Invest at eToro!
68% of retail investor accounts lose money when trading CFDs with this provider. You should consider whether you can afford to take the high risk of losing your money.