- Gold prices reversed three daily drops in a row, regaining $3,330.
- The US Dollar traded on the back foot on poor data and trade headlines.
- The yellow metal’s upside now retargets the monthly peaks near $3,440.
Gold managed to regain the smile on Thursday, rebounding to the $3,330 zone per troy ounce on the resurgence of the selling impetus in the US Dollar (USD), while a generalised knee-jerk in US yields across the curve also contributed to the precious metal’s bounce.
Adding to the sour mood around the Greenback, the usual weekly report on the US jobless claims disappointed estimates, showing further cooling of the labour market, and lending extra legs to the yellow metal.
A volatile day saw the US Dollar hit new weekly highs, just to plummet soon afterwards to the area of daily lows when gaiged by the US Dollar Index (DXY). This extreme price action in the Greenback followed news that a US federal court has dealt a significant setback to one of Donald Trump’s flagship economic policies, blocking his attempt to impose sweeping tariffs on imports from nearly every country in the world.
In a ruling that challenges the scope of presidential power, the Court of International Trade (CIT) said the emergency law used by the White House didn’t give the president the authority to act unilaterally on trade. Instead, the New York-based court reaffirmed that it’s Congress—not the president—that holds the constitutional power to regulate commerce with foreign nations.
The White House has responded by asking the court to freeze the decision while it pursues an appeal.
Gold’s short-term technical outlook
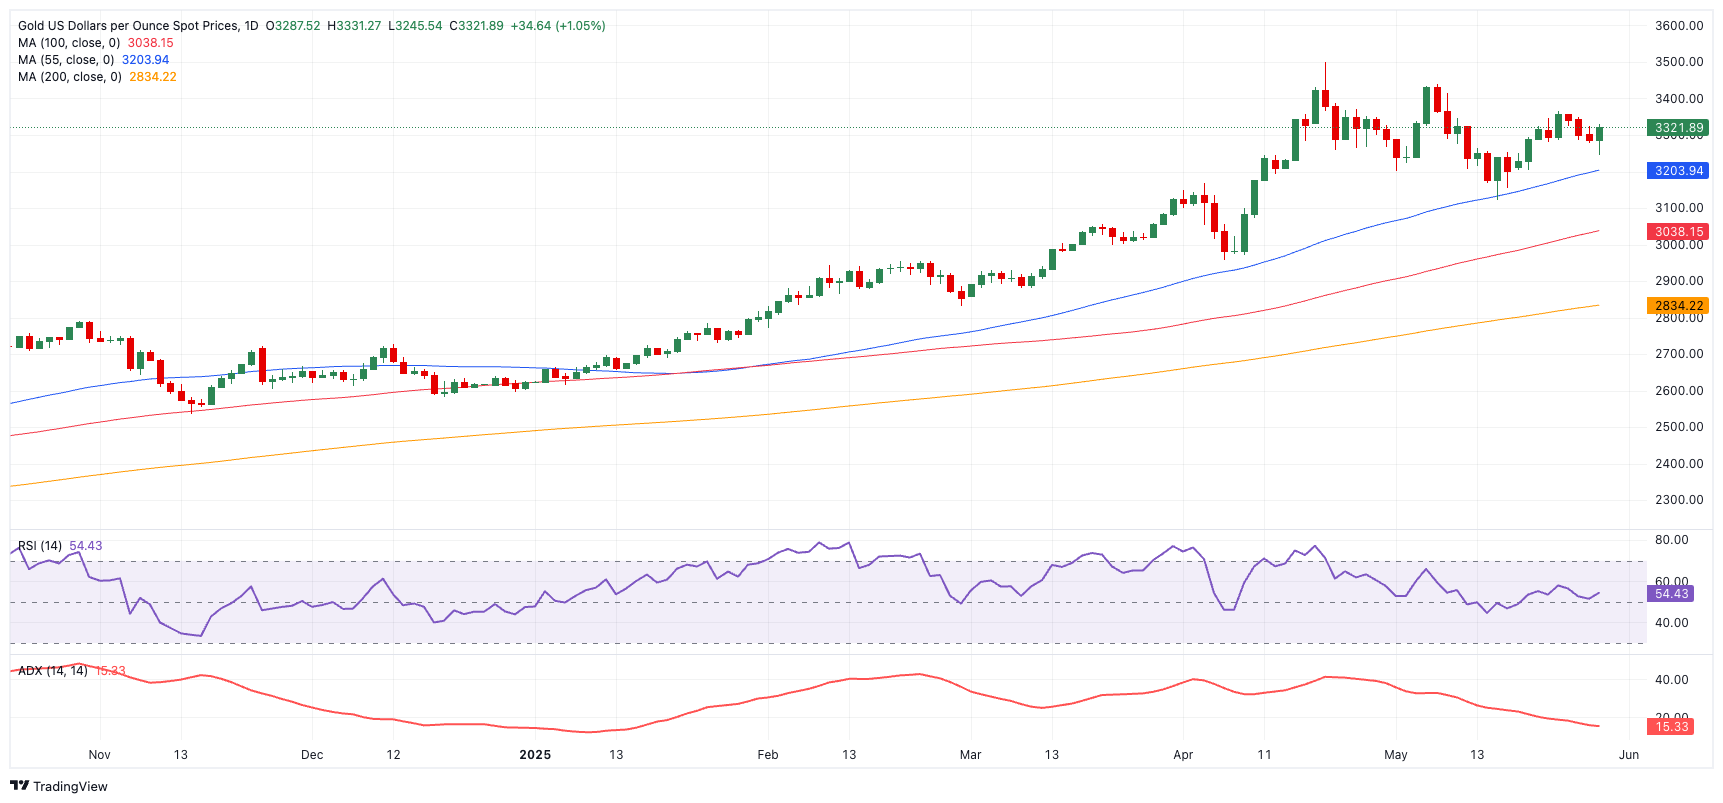
A new bullish bias might push gold back to its May peak of $3,438 (May 7), just ahead of the all-time high of $3,500 (April 22).
If the selling tendency regains pace, the metal may approach the transitory 55-day SMA at $3,203, then the May low of $3,120 (May 15) and the short-term 100-day SMA at $3,037.
Meanwhile, the Relative Strength Index (RSI) rose past 54, and the Average Directional Index (ADX) hovered around 15, indicating that the trend lacked strength.
XAU/USD daily chart