The price of gold has been a source of prosperity for the patient bulls, but the gravy train has probably left the station. Of course, we could be wrong about this, but history is on our side. Gold appears overvalued compared to most other assets, particularly silver and Treasuries. Further, speculators are already long, and the masses are wildly bullish. Just recently, there was a firestorm on FinTwit (the finance side of X) in which there were mass accusations of market manipulation after gold retreated $20 to $30 per ounce on a Friday. This is a sign of a frenzy; we all know how those end.
We aren’t anti-gold; there is a time and place for it, but we don’t believe this is either. Gold is merely an element on the periodic table that happens to be a bit more challenging to mine than most others due to the small nature of the pieces. Still, it isn’t necessarily scarce, nor is it liquid or useful for manufacturers. Gold is pretty, and humans assign it value, much like a piece of art. But at the end of the day, it isn’t entirely practical. Lastly, Central banks have been aggressive buyers of gold due to its diversification properties, but government agencies rarely sell gold. We are going out on a limb to say that they, but particularly we (the U.S. government) should! What good is an asset if you never monetize it?
The U.S. is sitting on roughly 8 tons of physical gold that hasn’t been marked-to-the-market for decades. The current balance sheet price is $42.22, but gold has recently traded in the high $ 2,900s. In other words, we aren’t fully accounting for its value; it is collecting dust while requiring costly security to guard it. Instead, we could sell or mark it to the market and then sell futures against it to protect the value. In any case, this could produce as much as $750 billion to 1 trillion to service debt (assuming my math and assumptions of the quantity of gold sitting in Fort Knox and other vaults are correct). This is a drop in the bucket, but we must start digging ourselves out of debt, a shovel at a time.
What if gold goes to $4,000? It took gold a decade to appreciate from $2,000 to $3,000, and according to our charts, the market is behaving similarly to 2011, a peak that lasted a decade. Thus, moving from $3,000 to $4,000 might take another decade. If so, the interest payments on an equivalent amount of debt would roughly wipe out the price gain. In my view, it would be like a household crippled by credit card debt holding on to a (currently) valuable baseball card collection instead of monetizing the asset to eliminate debt and interest. We must never forget that markets assign value to assets temporarily. Nothing is permanent; in 2011, gold retreated 45% from its euphoric highs. A similar move would put us near $1,650!
Perhaps liquidating gold to service debt will be looked at as kindly as refilling the Strategic Petroleum Reserve (SPR) in the first half of 2020. Similarly, although controversial due to economic security risks, selling part of the SPR in 2023 has worked out well thus far (assuming we can refill it at lower prices, which is a logistical challenge).
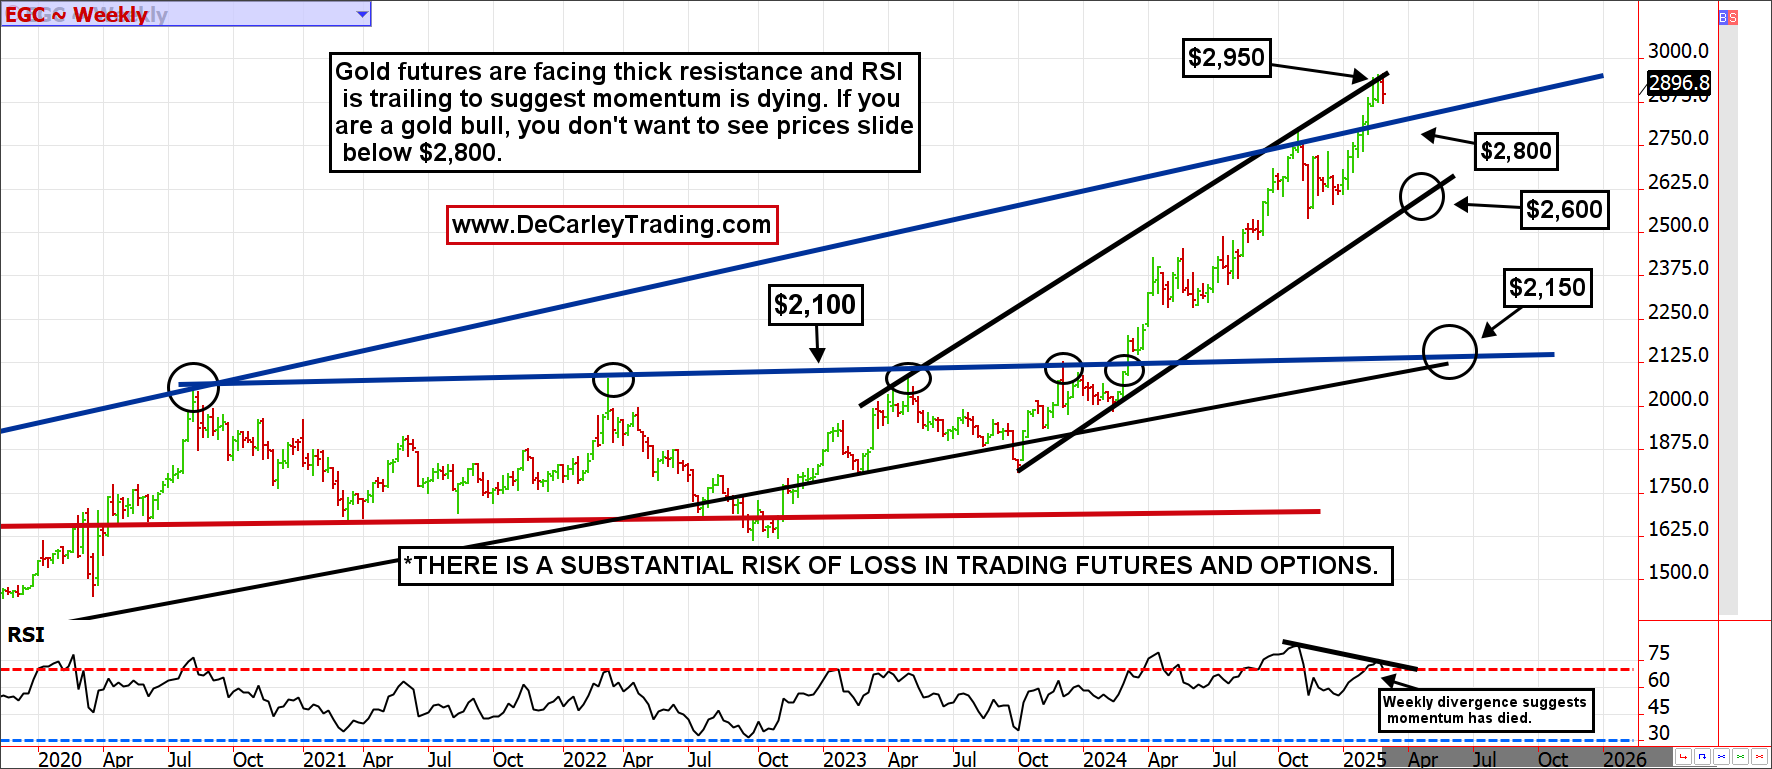
Weekly Gold chart
We’ve been sharing our monthly gold chart in recent newsletters, so we decided to mix things up with a weekly view. The premise remains the same: the market is contending with trendline resistance near $3,000ish, and the RSI suggests the euphoric buying is starting to wane. Despite gold futures reaching new all-time highs, the RSI failed to recover its October high. We could be on shaky ground. A break below $2,800 could get dicey for the bulls.
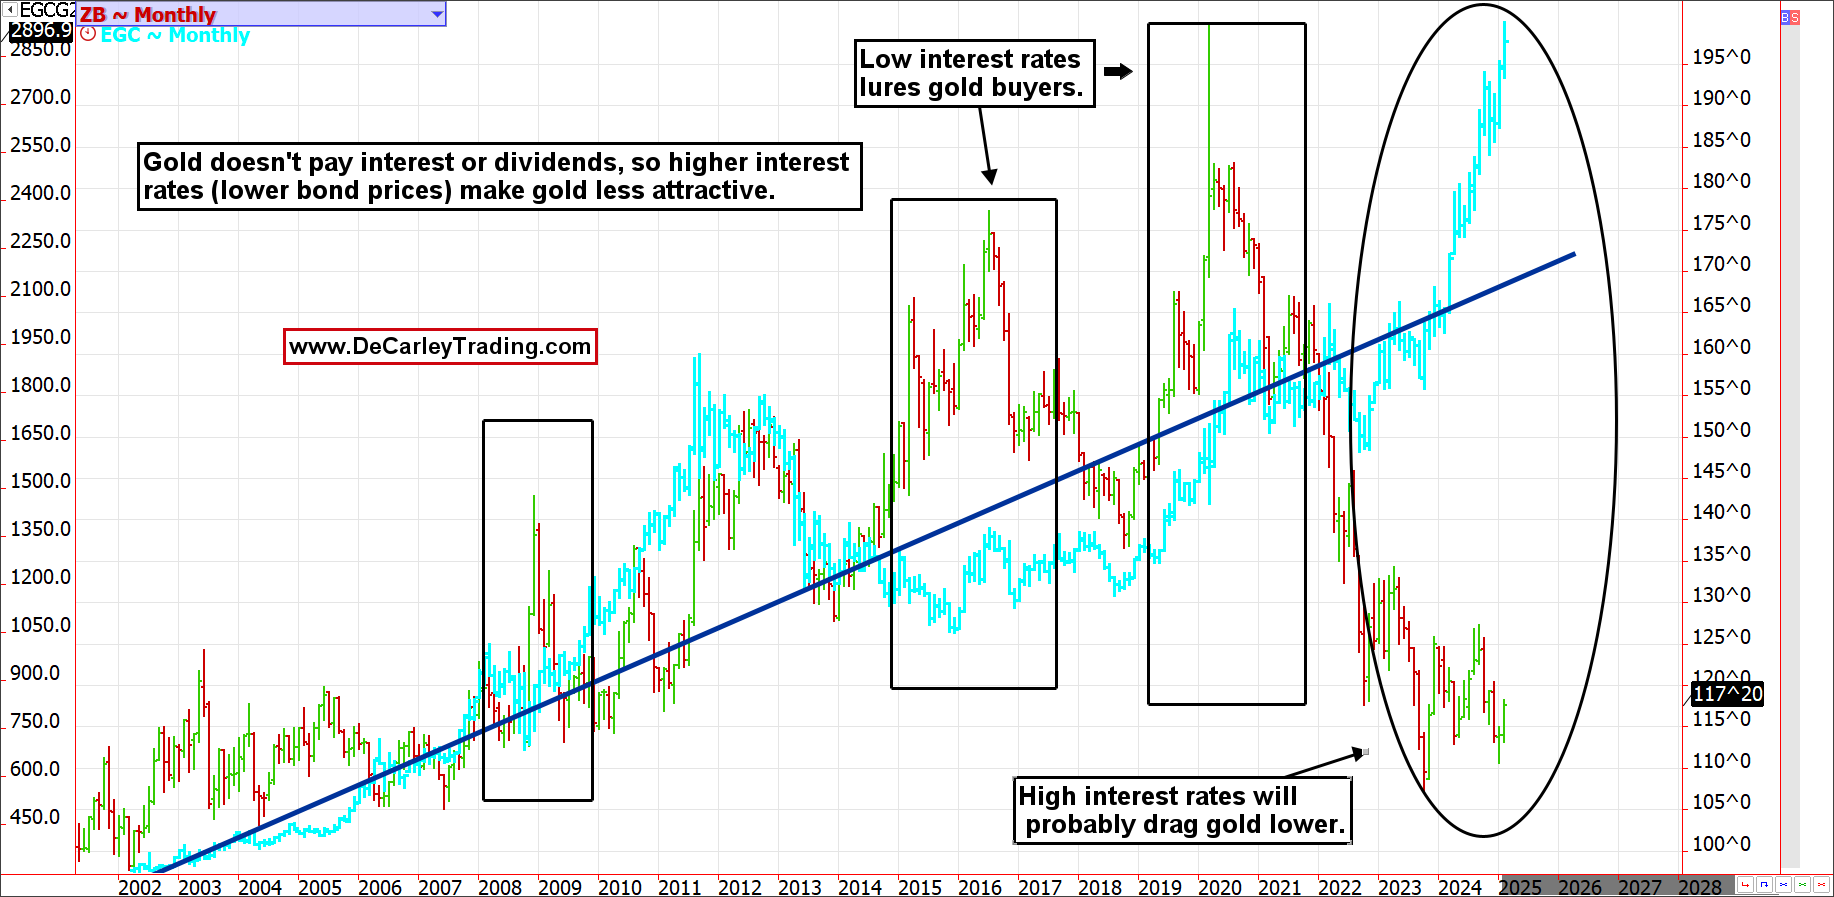
Gold vs. Treasuries
This chart isn’t new to our followers; we’ve been referring to it for several months. The monthly spread between Treasury bonds and gold is historically wide and almost guaranteed to narrow. The million-dollar question is: when? Gold and bonds are direct competitors for safe-haven investment dollars. One pays interest; the other doesn’t. When rates are high, money eventually moves out of gold and into Treasuries, and vice versa. After all, those buying gold at lofty levels have no parachute, but those buying Treasuries at a discount relative to proximal history receive 4% to 5% as a cushion against downside volatility.
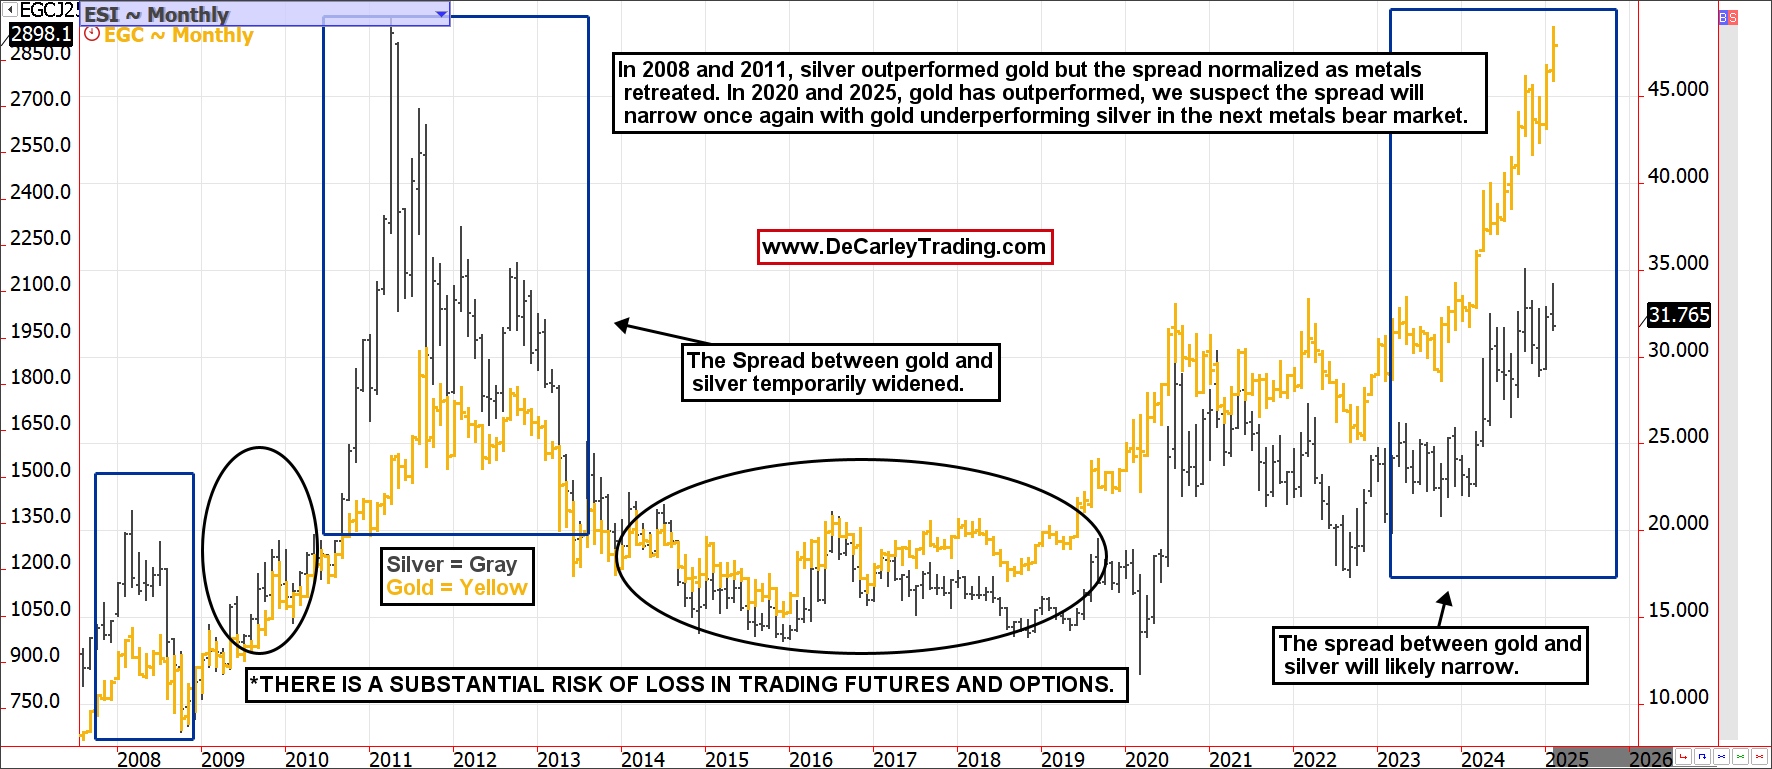
Gold vs. Silver
Word on the street is that silver will outperform gold because the ratio between the two is lopsided. Buying a single ounce of gold costs about ninety-one ounces of silver. At the trough in 2011, this ratio was near 30 (meaning thirty ounces of silver would buy an ounce of gold), but the ratio is usually closer to 70. We agree that this ratio will normalize, and the spread between gold and silver will narrow, but we disagree on how it gets there. In 2011, silver was the runaway metal, leaving the gold rally languishing in its footsteps. But once the metals boom was over, the spread narrowed, with silver falling faster than gold as they both entered a bear market. We are looking for a repeat of this narrowing, but with gold being the leader lower just as it was the leader higher.
Conclusion
We can’t see the future, but charts tell us what has happened in the past. We believe the gold rally will soon lose its shimmer. If you have made money on the way up with physical gold, we can help you hedge your price risk with options. Better yet, if you work for the US Treasury, give us a call we would love to help you lock in pricing! Kidding, not kidding.