
- Jito faces rejection at the 200-day EMA after soaring 15% on Sunday.
- Bitcoin Cash nears a breakout from a rising wedge, while a bearish RSI divergence signals potential risk.
- Solana bouncing off by 5.76% from the $140 cushion on Sunday teases with a double bottom reversal.
The broader cryptocurrency market ended the previous week with a minor recovery on Sunday. Holding gains from the prior day, Jito (JTO), Bitcoin Cash (BCH), and Solana (SOL) are the top performers over the last 24 hours. Despite a minor pullback on Monday, JTO, BCH, and SOL are close to breaking out critical levels, potentially extending gains this week.
Jito eyes 200-day EMA breakout
JTO fluctuates near the 200-day Exponential Moving Average (EMA) dynamic resistance at $2.245, as seen previously on Wednesday. At the time of writing, Jito trades at $2.242, takes a breather after scaling 15% on Sunday and creating a bullish engulfing candle.
A potential closing above the 200-day EMA could extend the uptrend to $2.425, last tested on March 25.
The Relative Strength Index (RSI) at 60 leaps off the halfway level on the daily chart, indicating a surge in bullish momentum. However, the peak is lower compared to last week, while JTO trades at a similar price level, signaling bearish divergence and increasing the risk of bullish failure.
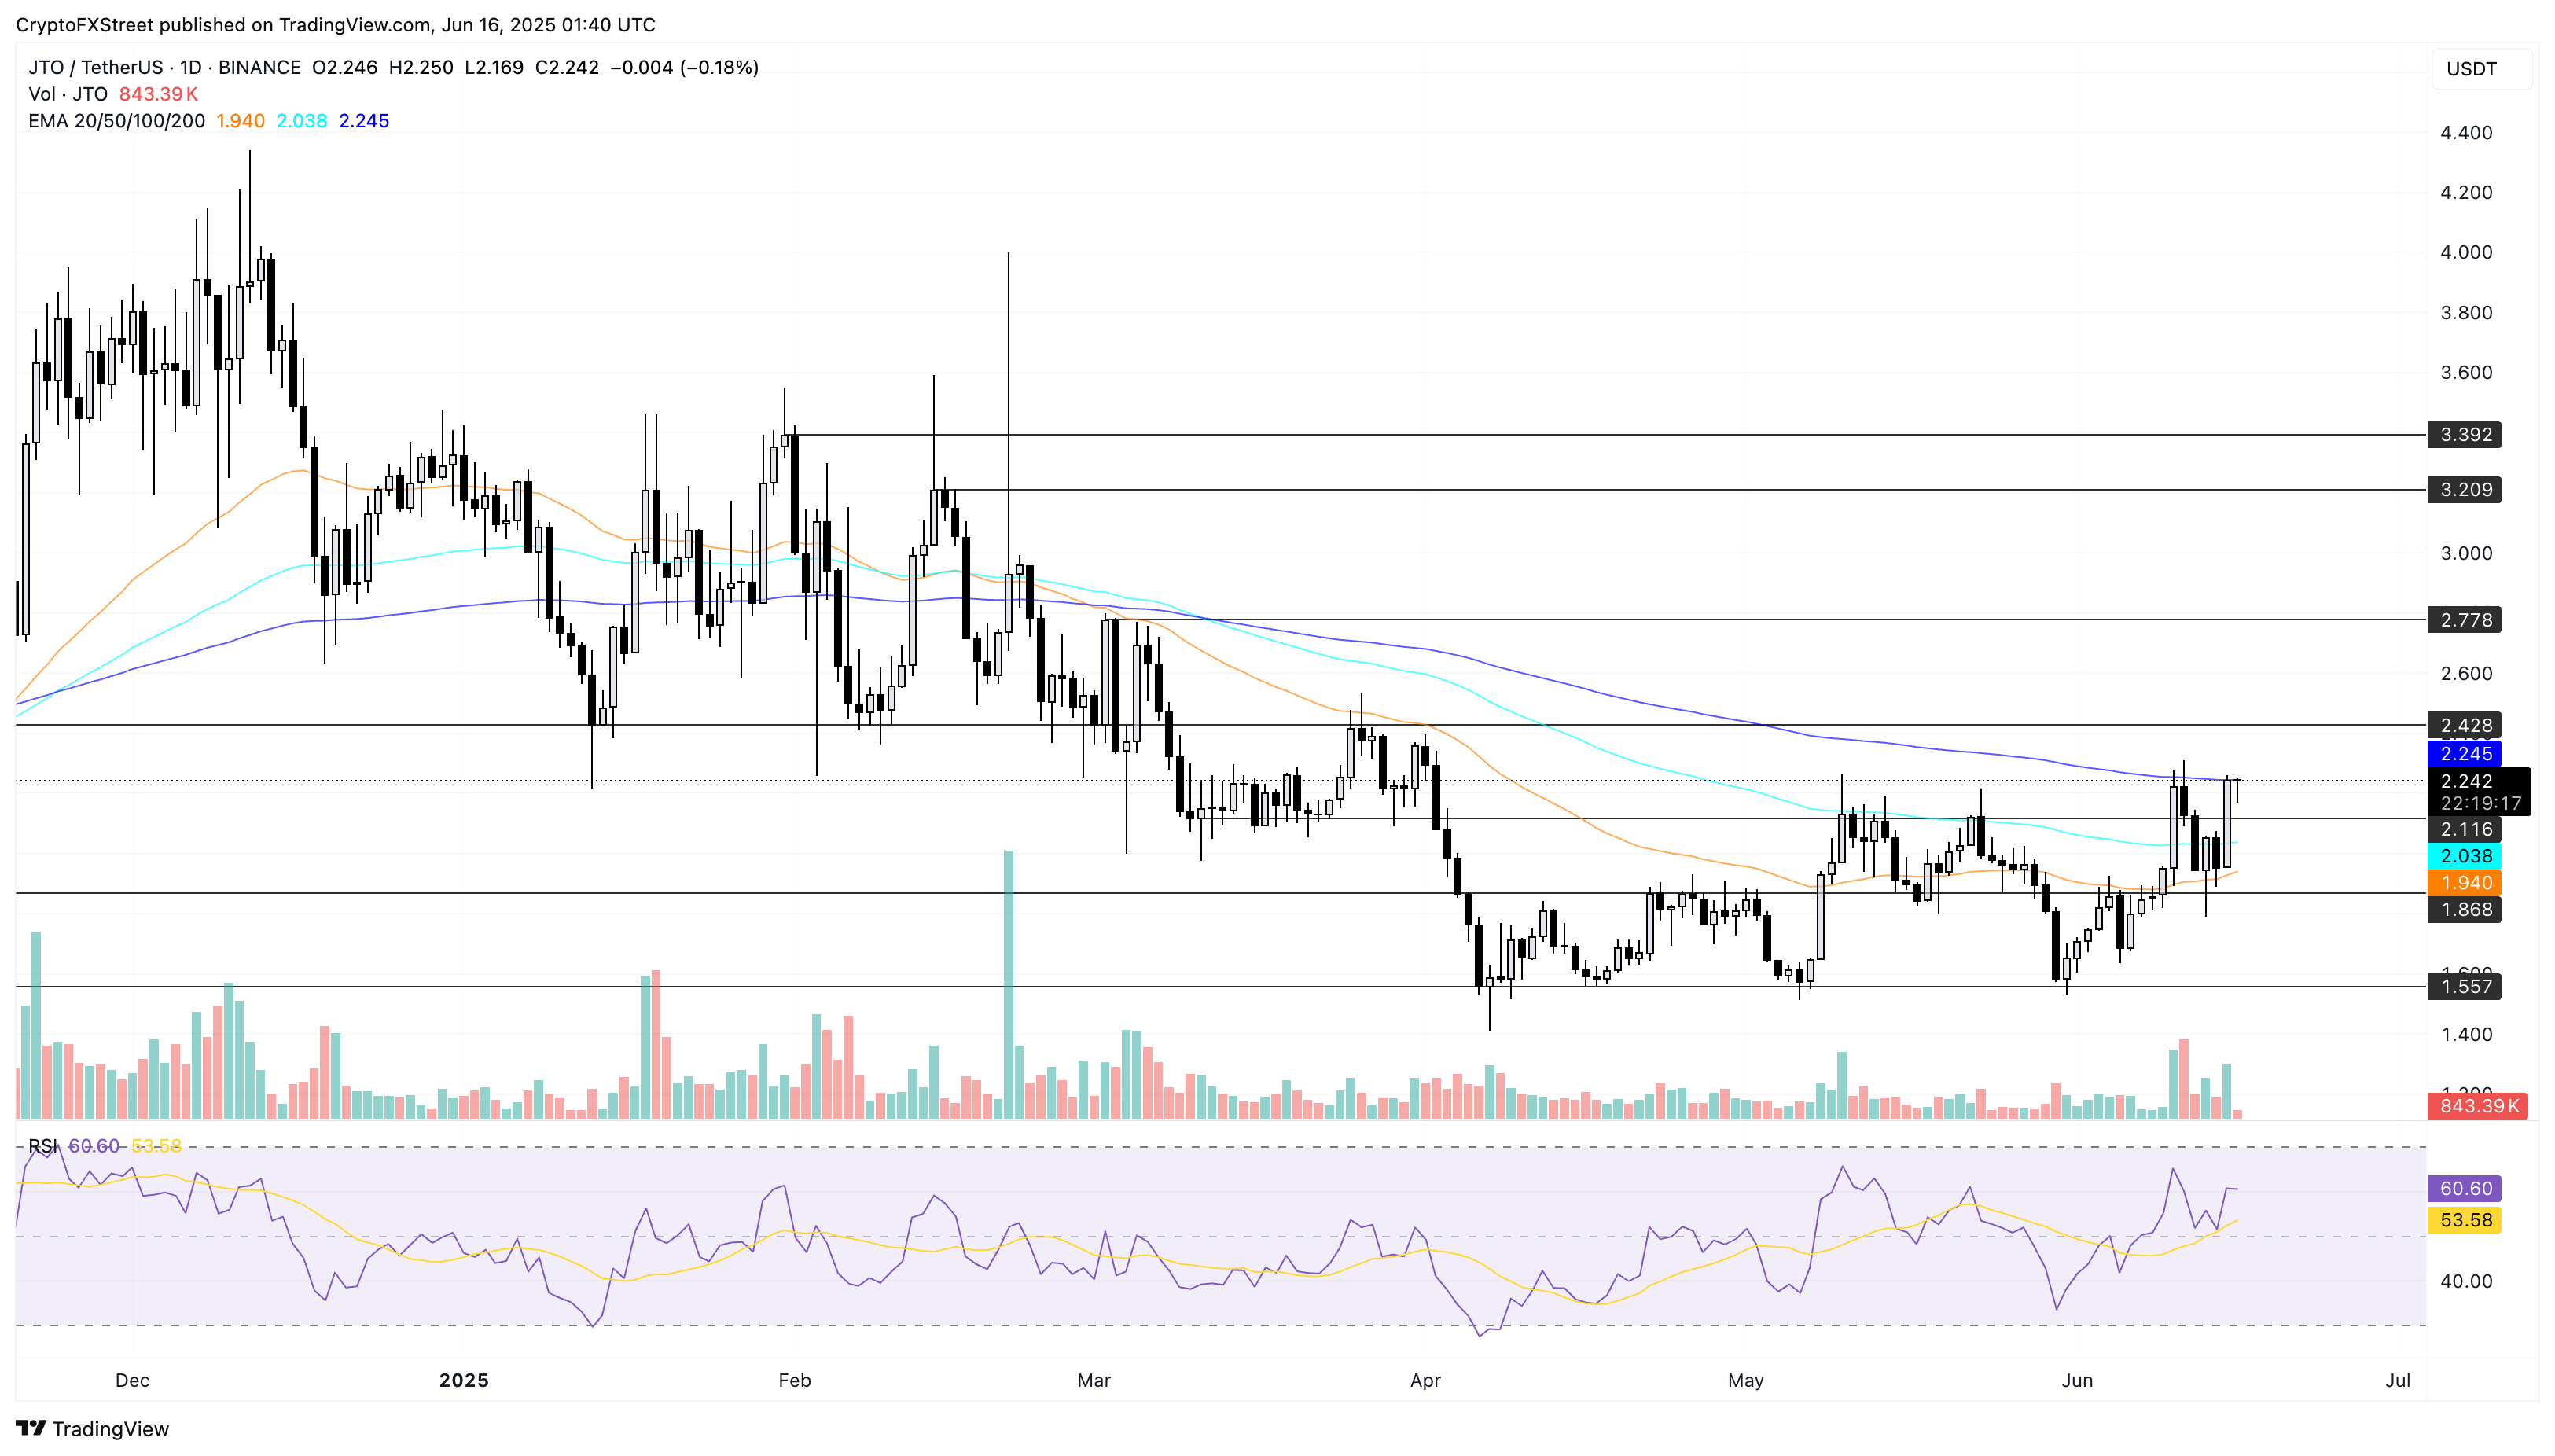
JTO/USDT daily price chart.
A decline in Jito closing below the 50-day EMA dynamic support at $1.940, which formed last week, could result in a steeper correction to $1.557.
Bitcoin Cash eyes trendline breakout despite RSI divergence
Bitcoin Cash shows no significant price movement at press time on Monday, as it slows down after a 6.85% rise the previous day. BCH nears a key rising resistance trendline formed by peaks on May 10 and May 22.
The Sunday recovery also breaks above the 50% Fibonacci level at $444, retraced from December’s high at $640 to April’s low at $249. Investors who purchased BCH between $444 and $249 could find the 61.8% Fibonacci level at $490 as potential profit-booking space, increasing the trendline breakout chances.
The RSI line at 63 shows a declining trend compared to the rising BCH peaks, indicating a bearish divergence. This warns of a pullback to the 50% Fibonacci level.
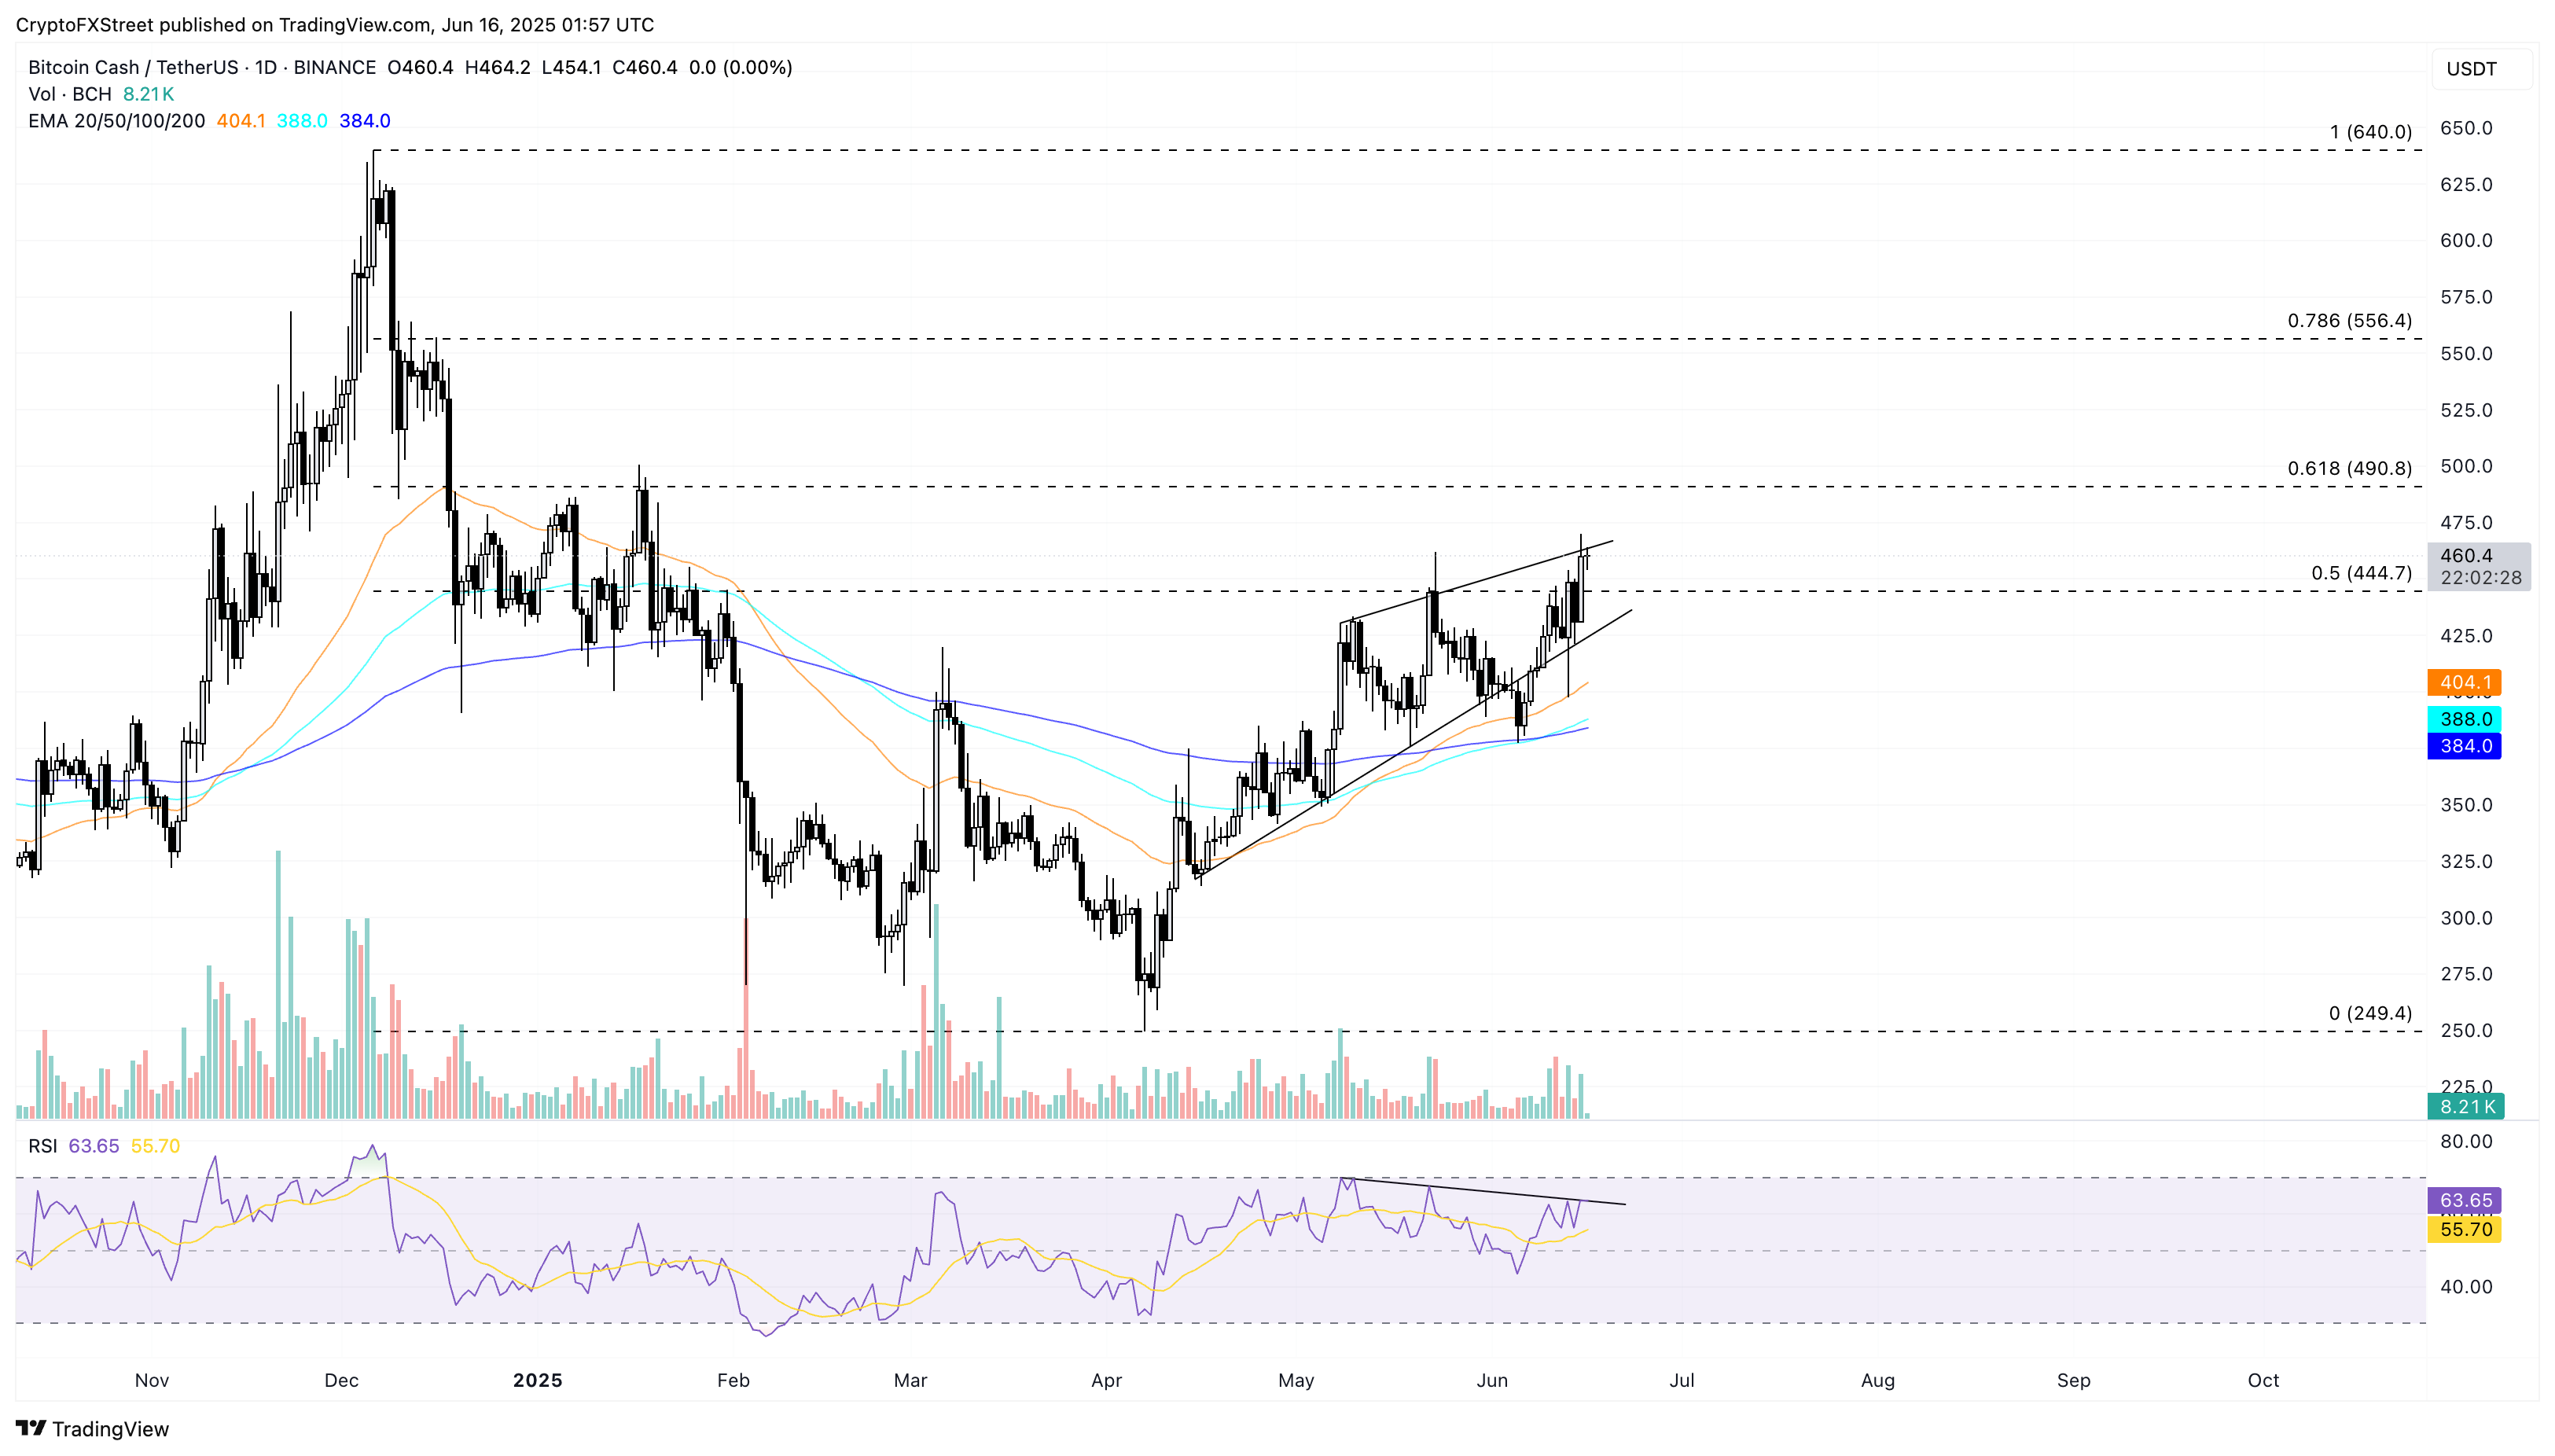
BCH/USDT daily price chart.
However, a closing below $444 could complicate bullish recovery chances and risk a retest of Saturday’s closing at $430, nullifying the weekend rally.
Solana’s double bottom reversal faces strong opposition
Solana trades in the green by over 2% at press time on Sunday, extending the 5.76% Sunday gains. With two consecutive bullish candles, SOL holds above $140 and reverses the previous week’s pullback trend.
The price action paints a double bottom reversal from the $140 support zone, with a neckline at $168, last week’s high. Further up, a critical resistance trendline formed by peaks on January 18, May 14, May 23, May 27, and June 11 stands as a key obstacle in Solana’s recovery.
A potential closing above $168 could help investors avoid bull traps present near such closely lying resistances. In such a scenario, the breakout rally could test the $180 supply zone.
The RSI line at 49 shows a reversal from the nearly oversold zone in the daily chart, indicating a spike in bullish momentum. A spike above the halfway level with room to reach the overbought zone could signal upside potential.
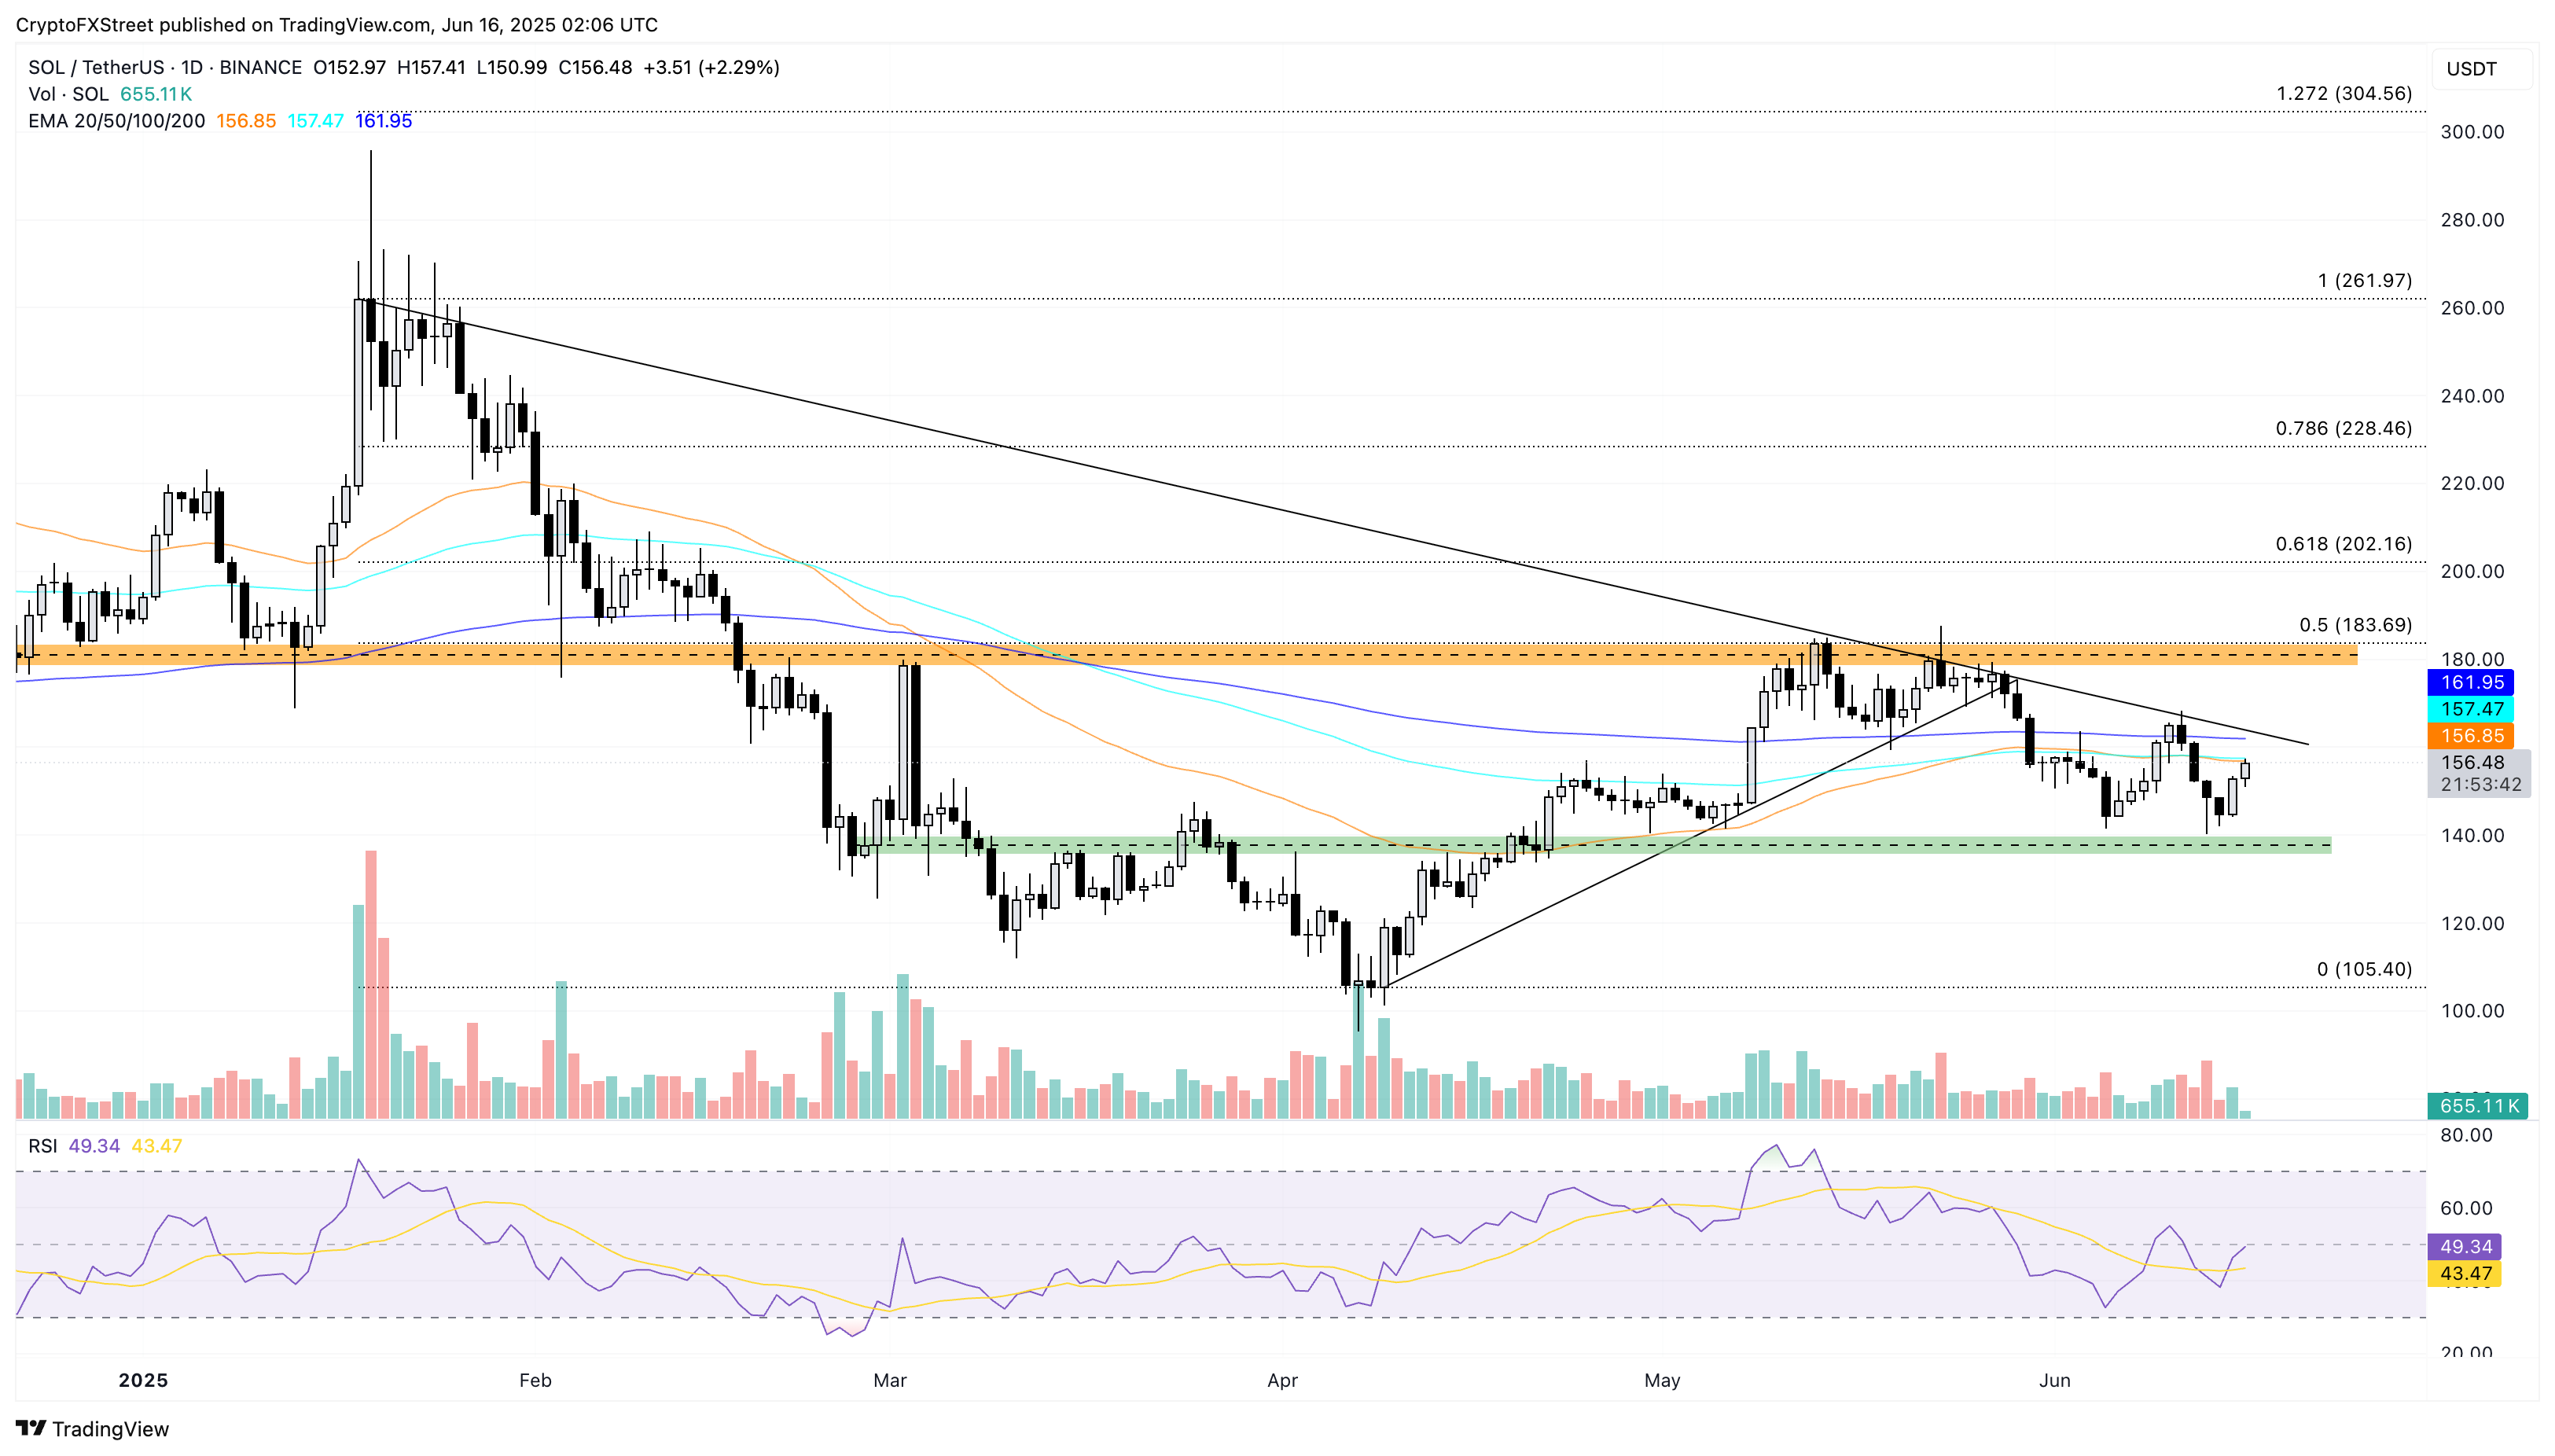
SOL/USDT daily price chart.
If Solana fails to surpass the resistance trendline, a reversal in Solana could risk losing the $140 zone. A push down the closing price under $140 might extend the correction to $105, the lowest year-to-date closing price.