- Official Trump meme coin faces 40 million $TRUMP token unlock on Friday, threatening more pain for investors.
- Investors brace for a hard landing, as this unlock accounts for 20% of the market capitalization and 4% of the total supply.
- Official Trump could absorb the supply shock if a double-bottom pattern ignites a bullish reversal from support at $7.40.
Official Trump ($TRUMP), the Presidential meme coin launched in January by the United States (US) President Trump family’s World Liberty Financial company, is in a precarious situation that could see volatility spike significantly.
According to the token unlock schedule, 40 million $TRUMP will be released on Friday, joining the circulating supply. The meme coin exchanges hands at $7.62 at the time of writing.
Official Trump 40 million token unlock signals more pain
The $TRUMP meme coin on the Solana blockchain is set to undergo a significant token unlock on Friday, with 40 million tokens valued at $305 million. This represents 4% of the total supply (1 billion coins) and approximately 20% of the market capitalization (200 million coins in circulating supply), per Cryptorank data.
It is worth noting that the unlock is primarily allocated to team wallets and Trump-affiliated entities. Investors should brace for heightened volatility and a possible impact on the price as liquidity surges.
Crypto markets, in general, are facing declining investor sentiment due to the trade war between the US and China. Moreover, no one knows how negotiations during the 90-day reciprocal tariffs’ pause will play out.
Following the token unlock on Friday, $TRUMP’s circulating supply will jump from 200 million to 240 million tokens – a 20% increase. Historically, large token unlocks often result in downward pressure, especially if the recipients of the coins sell on the open market.
The Official Trump meme coin is already down approximately 90% from its all-time high of $76.76 on January 19. It is losing more than 26% of its value in April, signaling waning investor confidence.
Technical indicators like the Moving Average Convergence Divergence (MACD) and the Relative Strength Index (RSI) reinforce the persistent bearish momentum. Moreover, $TRUMP holds below the 4-hour 50, 100 and 200 Exponential Moving Averages (EMAs), which further highlight the fragile technical structure.
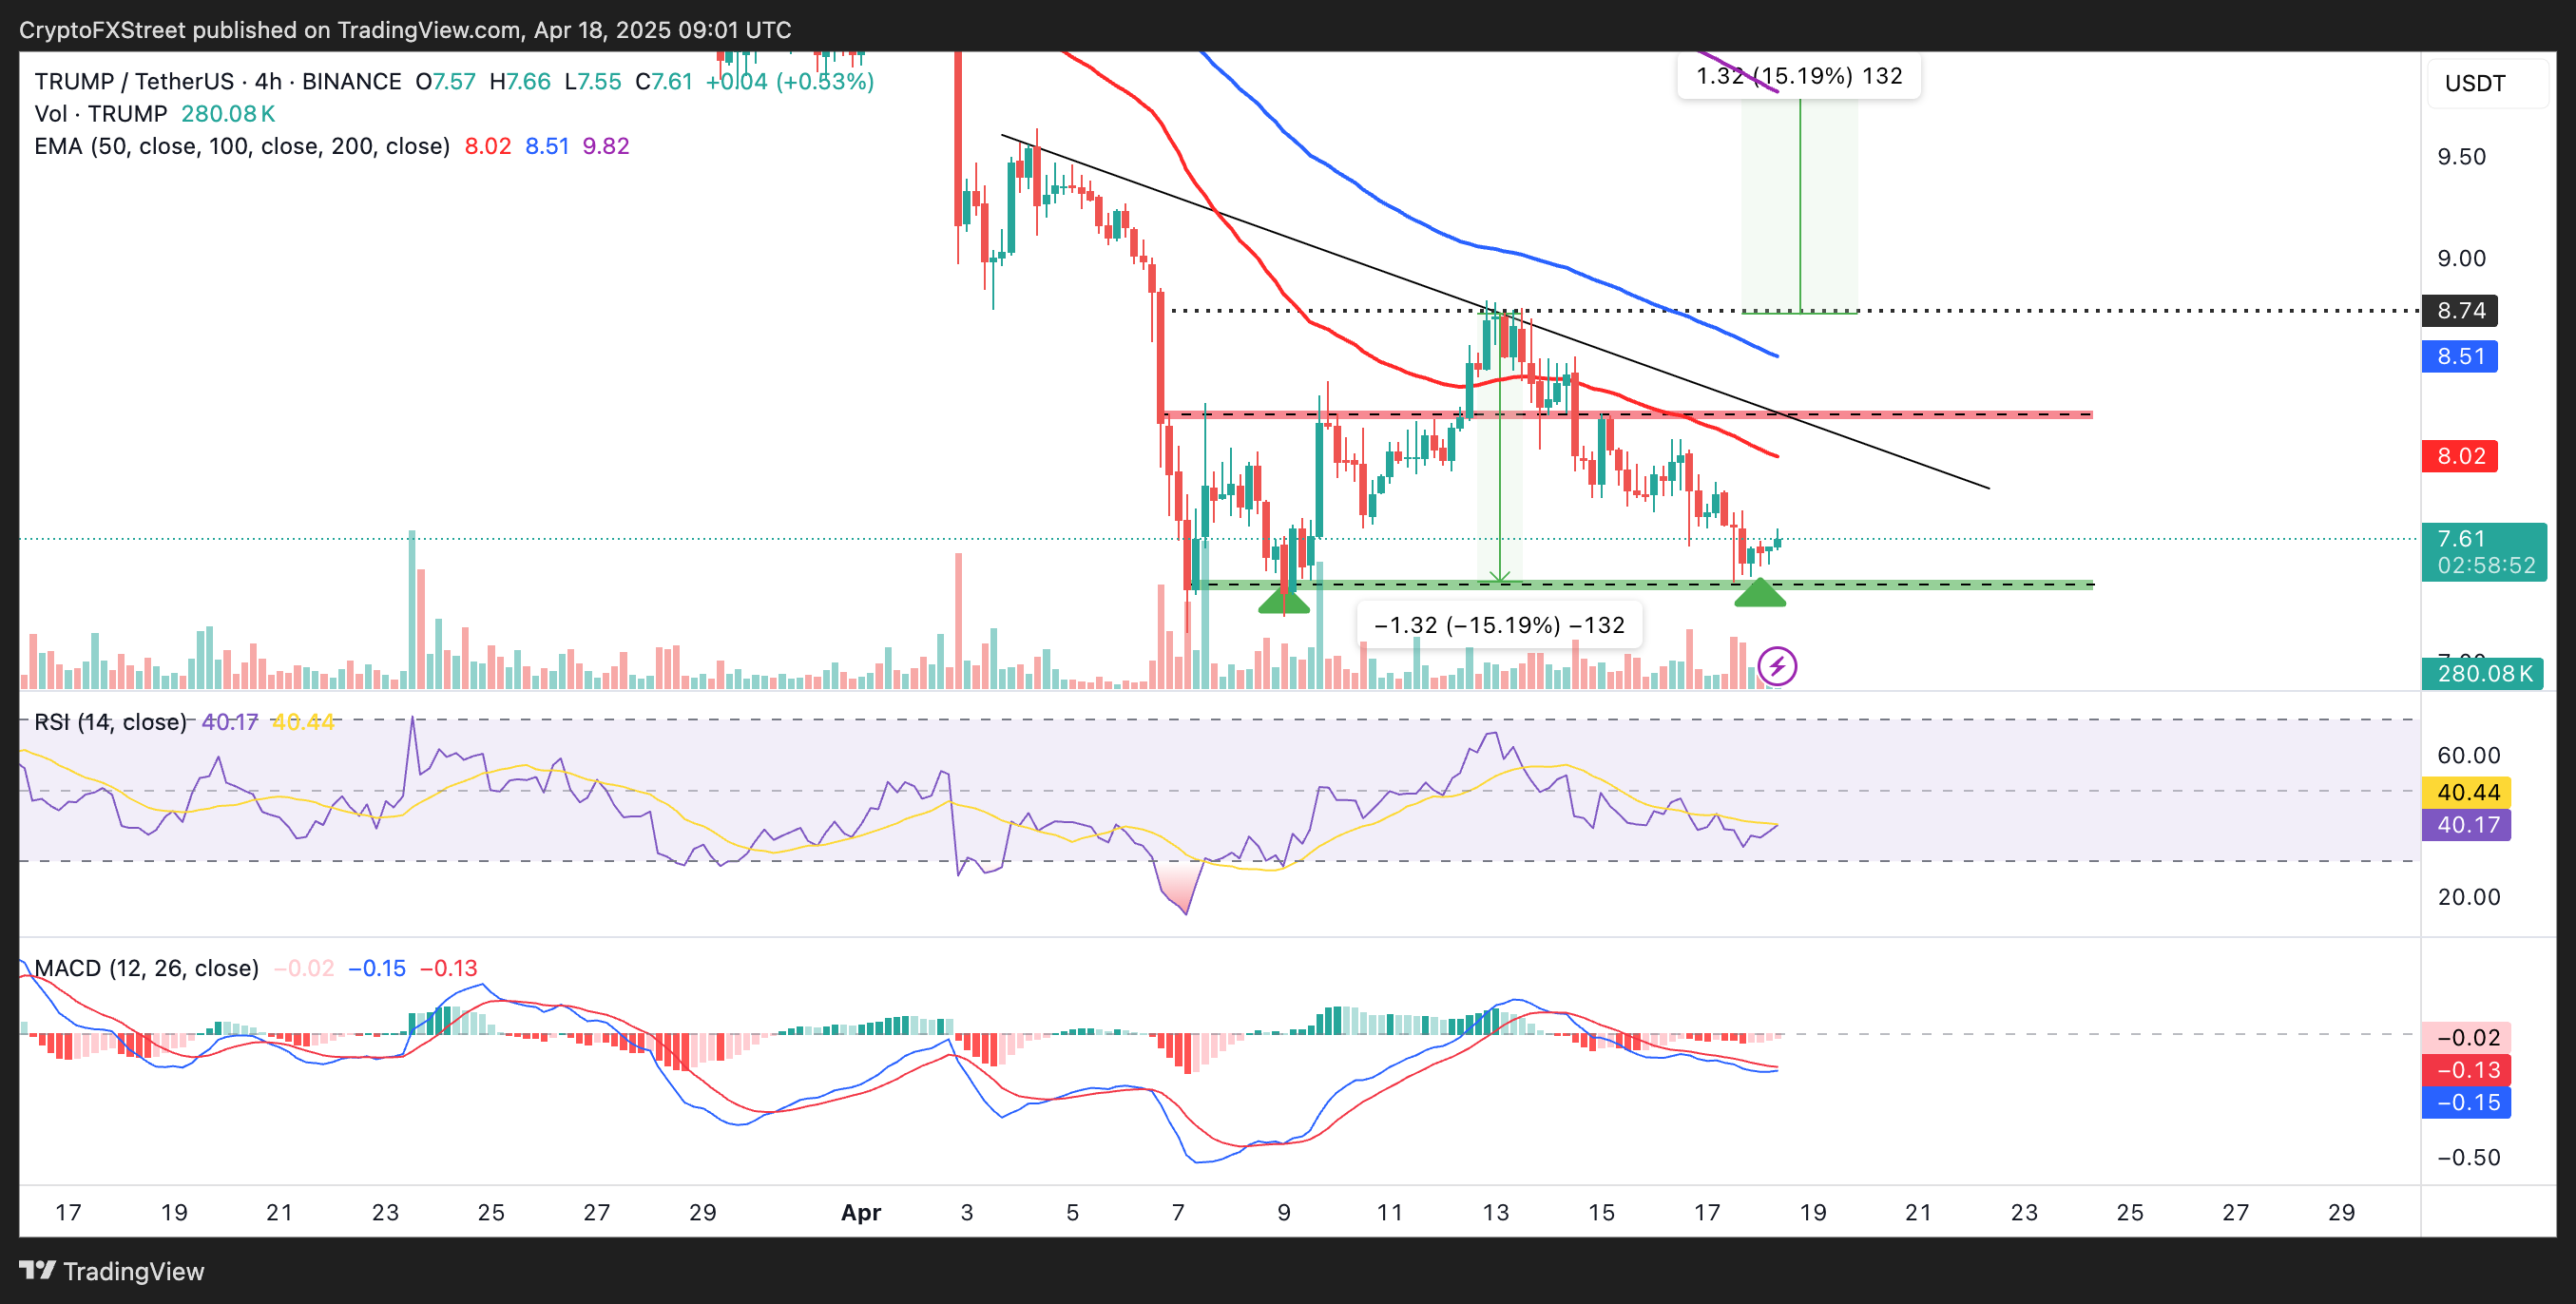
$TRUMP/USDT 4-hour chart
On the flip side, a double-bottom pattern has been forming in the same 4-hour timeframe, which could help shape a trend reversal in the coming days. For this pattern to hold, support at $7.40 must remain intact, and the impact from the token unlock must be minimal.
Moreover, the pattern’s resistance at $8.74 has to give way for a 15% breakout above the hurdle to $9.82. This target is arrived at by measuring the distance between the pattern’s bottom and top, extrapolated above the breakout point. However, losing the local bottom support at $7.40 may accelerate the sell-off, with $TRUMP creating new all-time lows.