

Manufacturing in Brief
Some brief figures on U.S. manufacturing include the following:
- In 2023, Manufacturing contributed $2.4 trillion to U.S. GDP amounting to 10.2 % of total U.S. GDP, measured in chained 2017 dollars, according to BEA data.
- Direct and indirect (i.e., purchases from other industries) manufacturing value added contributed an estimated 16.2 % of GDP (see Table 3.3 of AMS 100-76).
- According to the Current Population Survey, there were 15.0 million employees in U.S. manufacturing in 2024, representing 9.3 % of total U.S. employment.
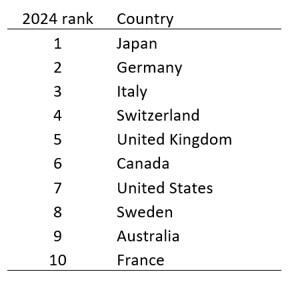
U.S. as a Brand
Frequently, countries are discussed as brands. Two rankings provide insight into the U.S. as a brand:
- U.S. ranks 7th in the Ipsos National Brands Index
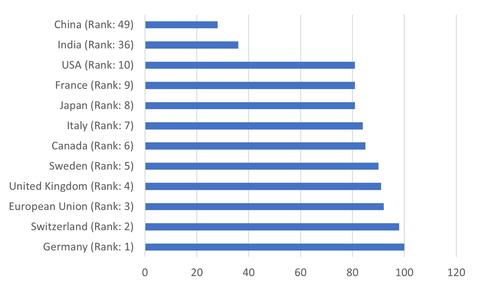
- U.S. ranks 10th among 49 total countries in Statistica’s Made-in-Country Index
Credit:
Table 5.2: NIST AMS 100-76
Ipsos National Brands Index, 2024
Credit:
Figure 5.11 from NIST AMS 600-16
Made-in-Country Index, 2017
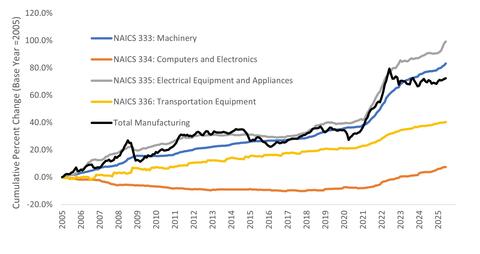
Inflation
Inflation has increased in recent years, which diminishes purchasing power.
- The prices received by producers for all manufacturing between July 2020 and July 2022 increased 33.4 %
- For context, in the fifteen years prior to that (i.e., June 2005 to June 2020) it increased 30.1 % in total
Credit:
NIST AMS 100-76
Inflation – Cumulative Percent Change in the Producer Price Index (Selling Price Received), 2005-2025
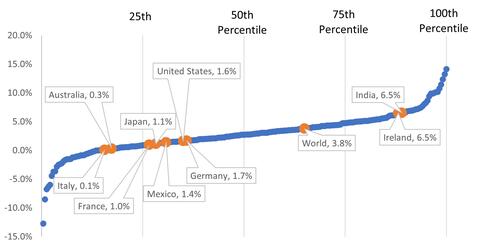
Manufacturing Growth
- U.S. compound real (i.e., controlling for inflation) annual growth between 1998 and 2023 (i.e., 25-year growth) was 1.6 %, which places the U.S. below the 50th percentile.
- The compound annual growth for the U.S. between 2018 and 2023 (i.e., 5-year growth) was 0.9 %. This puts the U.S. just below the 50th percentile and below the world average of 2.4 %.
Credit:
NIST AMS 100-76
National 25-Year Compound Annual Growth, by Country (1998 to 2023): Higher is Better
Manufacturing Industry Size
- In 2022, manufacturing accounted for 17.5 % of global GDP
- Since 1970, global manufacturing ranged between 13.7 % and 17.5 % of global GDP
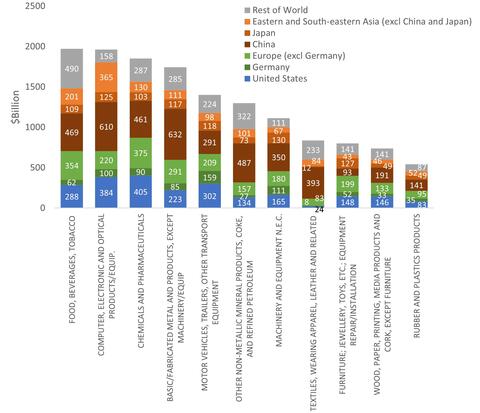
- U.S. manufacturing value added, as measured in constant 2015 dollars, is 15.1 % of global manufacturing value added putting it second to that of China, which is 31.0 %.
- Among the ten largest manufacturing countries, the U.S. is the 2nd largest manufacturing value added per capita while China ranked 5th. Out of all countries the most recent U.S. rank is 16th
- In terms of subsectors of manufacturing, China produces more than the U.S. in 9 of the 11 subsectors shown in Figure 2.8 from AMS 100-76.
Credit:
NIST AMS 100-76
Global Manufacturing Value Added by Industry, by Country/Region (2020)
Productivity
- The five-year annual compound growth in labor productivity is -0.7 %.
- The five-year annual compound growth in multifactor productivity is less than -0.7 %.
- The U.S. is ranked 9th in output per hour among 142 countries using data from the Conference Board.

Credit:
NIST AMS 600-16
Manufacturing Total Factor Productivity Index
Methods and Opportunities for Advancing U.S. Manufacturing: Below are change agent opportunities for advancing national manufacturing competitiveness discussed in AMS 100-76.
- Advancing competitiveness for a selection of industries can avoid overextension or dispersing of resources across many initiatives and losing the focus needed for competitiveness. These industries might include those that are the following:
- Products critical to national and/or economic security
- Products where there is great value resulting from differentiation (e.g., product quality)
- Critical supply chain items for the previous two categories
- Mitigating the risk of supply chain disruptions for moderately critical items by sourcing from lower-risk suppliers can help reduce costs and minimize losses.
- Developing strategic plans for change agent investments (e.g., standards, methods, technologies, and tools) can result in high-return systems of improvement. These types of systems include the following:
- Creating comprehensive plans from the initial stages of project development to dissemination and adoption by manufacturers for granular levels of investment (e.g., investments less than $1 million).
- Advancing forecast accuracy for granular levels of investment analysis (e.g., those less than $1 million).
- Developing a system of continuous improvement where predictions of impact are validated to recalibrate prediction methods and inform future projects.
- Incorporating plans for technology diffusion across the industry.
- Engaging in purpose driven economic analysis that motivates manufacturers to adopt innovations when they are cost effective, guides public investments by identifying the highest impact solutions, and justifies investments by showing impact and/or returns.
- Increasing the accuracy of investment predictions for manufacturing can guide manufacturers in adopting new technologies when they are cost effective and avoiding them when they are not. Increasing accuracy includes the following:
- Developing and implementing standardized classification systems for collecting/analyzing economic data, including the following:
- Classification of investments to collect data and systematically study/learn from past investments
- Classification of manufacturing industry costs to collect/analyze data on the impact of projects and to predict/forecast investment returns
- Developing and implementing standard methods for investment analysis that can be implemented by non-experts because there are a vast number of investment decisions being made without expert insight.
- Developing and implementing data tools and information on the various financial aspects of manufacturing that provide information that non-experts can understand.
- Developing and implementing standardized classification systems for collecting/analyzing economic data, including the following:
- Ensuring that structural conditions in the economy (e.g., considering competing impacts) encourage productive investments can increase or magnify the returns for competitiveness investments.
- Producing better products faster and with fewer resources can be achieved by developing and implementing standards, technologies, methods, tools, and/or guides that advance the following:
- Quality and performance of manufactured products
- Cost of manufactured products
- Cost of using manufactured products
- For countries that compete through differentiation (e.g., United States), competitiveness can be strengthened by creating and applying standards that make it easier to distinguish differences in product quality and performance. These standards help producers capture the value (e.g., profits) of higher-quality products. Such differentiation can be based on the following factors:
- Quality and performance
- Repairability and access to parts/components
- Life expectancy
- Cost of use (e.g., energy and maintenance)
- Advancing and maintaining competitive factors for conducting business can decrease costs and increase efficiency/productivity. These factors include the following:
- An educated and well-trained labor force
- An efficient transportation system
- An efficient and reliable energy system
- The mitigation of supply chain risks that are beyond the manufacturers control
- In addition to promoting the U.S. as a brand and maintaining/advancing the narrative on U.S. branding, maintaining and/or advancing standards for “Made in USA” branding can avoid diluting value.
Economic Environment
There is no agreed upon measure for examining the environment for research, innovation, and other factors for doing business, but there are a number of common measures, which are discussed below.
- The ranking of the U.S. in these measures are mixed, ranking high in some and lower in others.
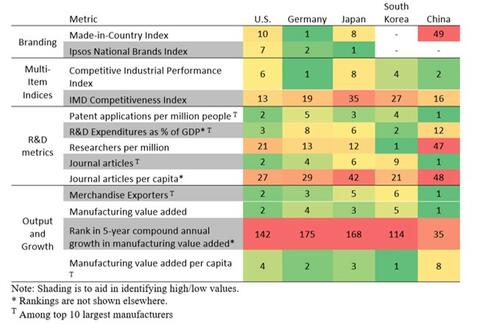
- The U.S. ranks
- 4th in 2021 patent applications
- 3rd in 2022 research and development expenditures as a percent of GDP
- 21st in 2021 researchers per million people
- 27th in 2022 journal article publications per capita.
- Competitiveness indexes
- The 2025 IMD World Competitiveness Index, which measures competitiveness for conducting business, ranked the U.S. 13th
- The World Economic Forum, which assesses the competitiveness in determining productivity, ranked the U.S. 5th.
- The Competitive Industrial Performance Index, which measures capacity to produce and export manufactured goods; technological deepening and upgrading; and world impact, ranked the U.S. 6th.
Credit:
NIST AMS 100-76
Rankings for a Selection of Metrics and Countries (Lower is Better)
Types of Goods Produced
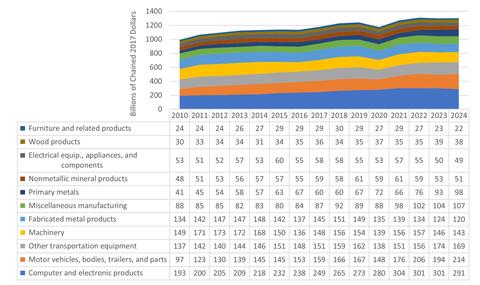
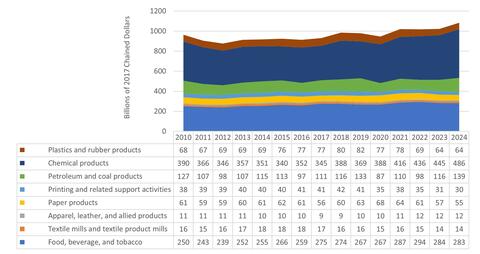
The largest manufacturing subsector in the U.S. is chemical products followed by computer and electronic products.
Credit:
NIST AMS 100-76
Value Added for Durable Goods by Type (billions of chained dollars), 2009-2023
Credit:
NIST AMS 100-76
Value Added for Nondurable Goods by Type (billions of chained dollars), 2009-2023
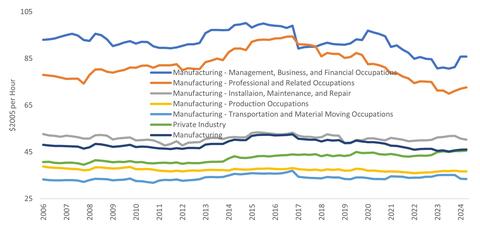
Manufacturing Safety, Compensation, and Profit
- Compensation
- As illustrated in Figure 4.5, employee compensation, which includes benefits, has had a five-year compound annual growth of -1.2 %.
- Profit
- Nonfarm proprietors’ income for manufacturing has had a five-year compound annual growth rate of 12.6 %.
- Corporate profits have had a five-year compound annual growth of 9.6 %.
- Safety
- Fatalities have a five-year compound growth rate of 2.7 %.
- Injuries have a five-year compound growth rate of -3.7 %.
- The injury rate has a five-year compound growth rate of -3.8 %
Credit:
NIST AMS 100-76
Employee Compensation (Hourly)
Manufacturing Assets and Supply Chain
- In 2023, U.S. manufacturing imported 18.7 % of its intermediate goods/services, resulting in 11.6 % of the output being of foreign origin.
- The largest supply chain entity for U.S. manufacturing by country is itself (83.0 %) followed by Canada (3.1 %), China (1.8 %), and Mexico (1.5 %).
- As of 2024, manufacturing net stock is split between intellectual property (34.2 %), structures (34.1 %), and equipment (31.6 %).
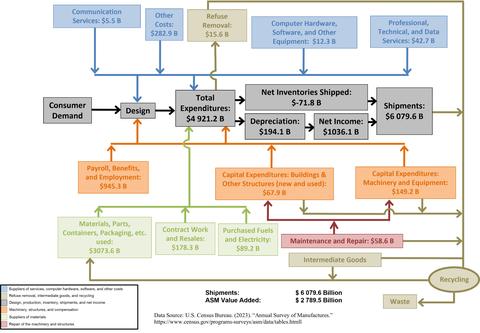
Credit:
Figure 3.1 from NIST AMS 600-16
Manufacturing Supply Chain, 2021