

Introduction
United States (US) sugar policy utilizes domestic marketing allotments and a tariff-rate quota (TRQ) system to regulate how much sugar is allowed to be marketed in the US (US Department of Agriculture (USDA) Economic Research Service (ERS), 2021a). Domestic marketing allotments establish the amount of sugar domestic producers are allowed to market by company and are split between cane sugar and beet sugar production. Forty countries are granted access to the World Trade Organization TRQ and many also export sugar into the US in amounts specified by various trade agreements. Additionally, Mexico exported an unrestricted amount of sugar into the US due to the North American Free Trade Agreement (NAFTA) (now the US–Mexican–Canada Agreement) during 2008–2013. However, there are now constraints to Mexico’s access to the US market due to the suspension agreements negotiated by the US and Mexican governments in 2014 (USDA ERS, 2021a) that suspended severe antidumping and countervailing duties imposed on Mexican sugar imports due to anticompetitive behavior. Additionally, the USDA Secretary of Agriculture can increase the TRQ amount if he or she believes the domestic supply of sugar is “inadequate to meet domestic demand at reasonable prices” (USDA ERS, 2021a).
US sugar prices are generally higher than world sugar prices since the domestic and foreign sugar supply is limited by US sugar policy, whereas the global market has surplus sugar supplies encouraged by production subsidies in most sugar-producing countries (e.g., Elobeid & Beghin, Reference Elobeid and Beghin2006; Hodari, Reference Hodari2018; Hudson, Reference Hudson2019). However, notwithstanding the rationale for US sugar policy, some sugar-using firms claim US sugar policy is harmful to their business since they cannot easily access the discounted subsidized world sugar price. The Sweeteners Users Association (SUA) (2021) claims that “US sugar prices are often double world prices—a cost that typically gets unfairly passed on to consumers.” The SUA recently issued a press release that called the US sugar program “overly restrictive” and committed to “keeping sugar supplies tight and domestic prices high” (SUA, 2021).
While somewhat counter-intuitive, Trejo-Pech et al. (Reference Trejo-Pech, DeLong, Lambert and Siokos2020) found that as US sugar prices increase relative to world sugar prices, US sugar-using firm financial performance improves. This may suggest relative (US to world) price increases are passed onto consumers. Further, candy industry reports assert that as sugar prices increase, sugar-using firms can use this as an opportunity to become more profitable by increasing sugar-containing-product (SCP) prices (IBIS World, 2020). If sugar-using firms become more profitable when sugar input costs increase, firms may be increasing SCP prices in an amount that exceeds their input-cost rise.Footnote
1
Consider, for example, the retail price of a Hershey candy bar, which grew 326% from 1983 to 2018, increasing from 35 cents to $1.49 (American Sugar Alliance (ASA), 2021). Meanwhile, the US wholesale refined sugar price rose less than 10 cents per pound, or just 36%, between 1983 and 2018 (USDA ERS, 2021b). Thus, there is evidence that sugar-using firms have, indeed, raised their SCP prices by a greater magnitude than the rise in US sugar price.
It is possible that while prices of some SCPs have increased more than sugar prices over time, SCP prices and sugar prices are not necessarily correlated. This prediction is based on the fact that the share of sugar cost is very low relative to SCP total production cost and SCP price. It is common industry knowledge that sugar costs represent a small fraction of SCP prices despite being a primary ingredient (Triantis, Reference Triantis2016). This is not uncommon; indeed, USDA ERS (2021c) documents the relatively low commodity value contained within most food products in the US. In 2020, the average cost of sugar in highly sweetened SCPs ranged from 1.56% to 10.03% (ASA, 2021). Thus, since sugar cost represents such a minor component of SCP price, it is possible that there is no direct relationship between changes in sugar prices and SCP prices.
The goal of this paper is to determine the factors that affect SCP prices by estimating a hedonic pricing model of SCP prices. Specifically, this study will use a database of SCP prices from 2008 through 2020 to determine the factors influencing SCP prices. SCPs owned by publicly traded firms with observed firm financials are used in the analysis. The hypothesis of whether US sugar prices affect SCP prices is also tested. While research shows that, counterintuitively, sugar-using firms are more profitable when US sugar prices increase relative to world sugar prices (Trejo-Pech et al., Reference Trejo-Pech, DeLong, Lambert and Siokos2020), no known research has investigated whether US sugar prices are statistically significant in determining SCP prices. Given sugar prices represent a small fraction of SCP prices (Triantis, Reference Triantis2016; ASA, 2021), it is possible US sugar prices are not associated with SCP prices. This research is the first known study to estimate the determinants of SCP prices. Results will be informative to US sugar policy as well as those interested in sugar-using firm behavior (e.g., SCP determinants). This is important research given SCPs represent a large sector of the agribusiness economy and annually bring in billions of dollars of revenue. For example, SCPs include candy, ice cream, snack foods, baking mixes, and soft drinks which are sectors that in 2020 represented approximately $9.9 billion, $7.8 billion, $41.7 billion, $31.1 billion, and $38.5 billion of revenue, respectively (IBIS World, 2020).
Literature Review
Previous research has analyzed many aspects of the US sugar market such as sugar-sweetened beverage taxes (e.g., Cawley et al., Reference Cawley, Frisvold, Jones and Lensing2021; Lee et al., Reference Lee, Falbe, Schillinger, Basu, McCulloch and Madsen2019; Allcott, Lockwood, and Taubinsky, Reference Allcott, Lockwood and Taubinsky2019), the impact of NAFTA (e.g., Kennedy and Schmitz, Reference Kennedy and Schmitz2009; Knutson, Westhoff, and Sherwell, Reference Knutson, Westhoff and Sherwell2010; Schmitz and Lewis, Reference Schmitz and Lewis2015), the effect of Mexican sugar dumping and countervailing actions on the US sugar market (e.g., Schmitz, Reference Schmitz2018; Lewis and Schmitz, Reference Lewis and Schmitz2015; Zahniser et al., Reference Zahniser, Kennedy, Nigatu and McConnell2016), US genetically modified (GM) sugar beets (e.g., Lewis et al., Reference Lewis, Grebitus and Nayga2016a; Kennedy, Schmitz, and DeLong, Reference Kennedy, Schmitz and DeLong2019; Carter and Schaefer, Reference Carter and Schaefer2019), consumer preferences for sugar (e.g., Lewis, Grebitus, and Nayga, Reference Lewis, Grebitus and Nayga2016a; Lewis, Grebitus, and Nayga, Reference Lewis, Grebitus and Nayga2016b; Lewis, Grebitus, and Nayga, Reference Lewis, Grebitus and Nayga2016c; Lewis and Grebitus, Reference Lewis and Grebitus2016), and how US sugar prices impact sugar-using firm profitability (e.g., Triantis, Reference Triantis2016; Trejo-Pech et al., Reference Trejo-Pech, DeLong, Lambert and Siokos2020).
Cawley et al. (Reference Cawley, Frisvold, Jones and Lensing2021) provide a review of the literature concerning the impact of sugar-sweetened beverage taxes. They also analyzed Nielsen Retail Scanner Data along with hand-collected price data on sugar-sweetened beverages to determine the passthrough effect of a sugar-sweetened beverage tax in Boulder, Colorado. They found that the passthrough effect of the tax was slightly less than 75% when analyzing hand-collected store data, but was 50% when using the scanner data. In general, they found consumers paid most of the tax.
Schmitz and Lewis (Reference Schmitz and Lewis2015) found that NAFTA cost US sugar producers $474 million to $1.3 billion annually due to increased Mexican sugar imports into the US. Lewis and Schmitz (Reference Lewis and Schmitz2015) estimated that if the Mexican government no longer owned and operated 20% of their sugar industry, US sugar producers would gain $525 million to $1.6 billion annually. Schmitz (Reference Schmitz2018) observed that the 2014 Mexican–US sugar suspension agreements would have saved US sugar producers $138 million annually if these agreements had been in effect from 2008 through 2014.
Kennedy, Schmitz, and DeLong (Reference Kennedy, Schmitz and DeLong2019) used a partial equilibrium framework to evaluate the possible demand impact of US sugar beets being GM compared to their non-GM sugarcane counterpart. They found that the negative demand impact from sugar beets being GM could outweigh any supply induced gains from GM sugar beets. They concluded that since the National Bioengineered Food Disclosure Standard does not classify beet sugar as bioengineered, this negative welfare result would not be fully realized for sugar beet producers.
Trejo-Pech et al. (Reference Trejo-Pech, DeLong, Lambert and Siokos2020) examined the effect of US sugar policy on sugar-using-firm profitability when considering both US and world sugar prices. They examined how the relative US-to-world sugar price ratio impacted US firms’ return on assets (ROAs) and market-to-book (MTB) ratio. Counterintuitively, they found that as US sugar prices increase relative to world sugar prices, US sugar-using firms became more profitable.
While research has examined several aspects of the US sugar market and US policy, no known research has examined factors associated with SCP prices and whether US sugar prices are associated with SCPs. To contribute to the economics of sugar literature, this research analyzes a panel of SCP prices across various sugar-using firms and examines whether US sugar prices are associated with SCP prices.
Conceptual Framework and Hypothesized Results
The goal of this paper is to determine factors influencing SCP prices with a particular interest on understanding the role of input sugar prices. Trejo-Pech et al. (Reference Trejo-Pech, DeLong, Lambert and Siokos2020) was the first known research to examine the relationship between US sugar prices and sugar-using firm performance as measured by firms’ ROAs and MTB ratios. It was found that as the ratio of US wholesale refined beet sugar price to the world refined sugar (US-to-world) price increased, firms’ ROAs increased. However, in their second model specification, there was no statistically significant relationship between the US-to-world sugar price ratio and firms’ MTB ratios.
Trejo-Pech et al. (Reference Trejo-Pech, DeLong, Lambert and Siokos2020, page 14) concluded their research with a possible explanation of, “US sugar-using firms must pass on higher costs to consumers when relative prices increase or do not pass on discounts to consumers when relative sugar prices decrease.” We examine this outstanding question using a unique data set of SCP prices as a dependent variable, rather than using firm profits (ROA and MTB ratios) as a dependent variable like Trejo-Pech et al. (Reference Trejo-Pech, DeLong, Lambert and Siokos2020), and by including sugar prices as an independent variable. Thus, this research will directly estimate whether higher US sugar prices are passed on to consumers while controlling for other relevant possible determinants of food prices.
Previous literature has examined determinants of food prices (e.g., Richards and Hamilton, Reference Richards and Hamilton2015; Volpe, Risch, and Boland, Reference Volpe, Risch and Boland2017; Hamilton, Liaukonyte, and Richards, Reference Hamilton, Liaukonyte and Richards2020; Nakamura, Reference Nakamura2008; Ghazaryan et al., Reference Ghazaryan, Westgren, Parcell and Gedikoglu2018; Nakamura and Zerom, Reference Nakamura and Zerom2010). Factors theorized to affect food prices include input prices (Nakamura and Zerom, Reference Nakamura and Zerom2010; Volpe, Risch, and Boland, Reference Volpe, Risch and Boland2017; Richards and Hamilton, Reference Richards and Hamilton2015; Hamilton, Liaukonyte, and Richards, Reference Hamilton, Liaukonyte and Richards2020), product characteristics such as size and appearance (Ghazaryan et al., Reference Ghazaryan, Westgren, Parcell and Gedikoglu2018), macroeconomic factors (Richards and Hamilton, Reference Richards and Hamilton2015; Volpe, Risch, and Boland, Reference Volpe, Risch and Boland2017), and market power (Hamilton, Liaukonyte, and Richards, Reference Hamilton, Liaukonyte and Richards2020; Richards, Hamilton, and Yonezawa, Reference Richards, Hamilton and Yonezawa2017). Similarly, it is hypothesized that input prices, product characteristics, macroeconomic factors, and firm size will have an impact on SCP prices. While no located research has examined how firm financial performance affects food prices, this research postulates it will affect SCP prices since Trejo-Pech et al. (Reference Trejo-Pech, DeLong, Lambert and Siokos2020) found a relationship between firm profitability measures and sugar prices, and because firms’ market power throughout the food supply chain is an important consideration in explaining food prices (Hamilton, Liaukonyte, and Richards, Reference Hamilton, Liaukonyte and Richards2020; Richards, Hamilton, and Yonezawa, Reference Richards, Hamilton and Yonezawa2017). Only SCP prices from publicly traded sugar-using firms were utilized so firm size and financial performance variables could be included as independent variables in the analysis.
The categories of variables hypothesized to affect SCP prices are SCP characteristics—including sugar price and other characteristics—firm size and financial performance, and macroeconomic conditions. A traditional hedonic pricing model is estimated such that for each uniquely identified SCP, i, in a calendar quarter, t, the SCP price per pound (SCPprice
i,t
) can be explained as a function of the following factors:

$$SCPpric{e_{i,t}} = f(SC{P_{i,t}},{F_{i,t}},M{E_{i,t}}).$$
where SCP
i,t
are characteristics relating to the SCP, F
i,t
are variables relating to the respective SCP firm, and ME
i,t
controls for macroeconomic conditions over the sample’s time period.Footnote
2
Sugar-Containing-Product Characteristics
Input prices (e.g., Volpe, Risch, and Boland, Reference Volpe, Risch and Boland2017; Richards and Hamilton, Reference Richards and Hamilton2015; Hamilton, Liaukonyte, and Richards, Reference Hamilton, Liaukonyte and Richards2020) and product characteristics (e.g., Ghazaryan et al., Reference Ghazaryan, Westgren, Parcell and Gedikoglu2018) are primary determinants of food prices. It is expected that the SCP characteristics that will impact the SCP price per pound are sugar prices (SugarPrice), the percentage of sugar in the SCP (%Sugar), and SCP weight (Weight).
To test the effect of sugar prices on SCP prices, four specifications of sugar prices are examined across four different models: (1) US wholesale refined beet sugar prices, (2) quarterly lagged US wholesale refined beet sugar prices, (3) US-to-world sugar prices, and (4) US-to-world quarterly lagged sugar prices. With respect to all four specifications, it is hypothesized that the sugar prices will either not be significant in the model or else will be significant and positive (Table 1). If sugar prices are significant and positive, this would be consistent with Trejo-Pech et al. (Reference Trejo-Pech, DeLong, Lambert and Siokos2020) and the SUA’s (2021) declaration that higher sugar prices caused by US sugar policy are “unfairly” passed on to consumers. On the other hand, since US sugar prices represent such a small fraction of SCP prices (Triantis, Reference Triantis2016; ASA, 2021), it is also possible that they do not have an impact on SCP prices and are not statistically significant in the model. This argument is also consistent with research documenting a weak transmission of coffee bean prices to consumer prices due to a relatively low share of coffee bean cost relative to the overall cost of manufacturing coffee (Bettendorf and Verboven, Reference Bettendorf and Verboven2000).
Variables, definitions, and hypothesized signs

Summary statistics of sugar-containing-product (SCP) prices, SCP characteristics, firm financial performance, and recessions

Similar to Ghazaryan et al. (Reference Ghazaryan, Westgren, Parcell and Gedikoglu2018), food product characteristics are also included in the model. The estimated coefficient on the percentage of the product’s weight that is sugar (%Sugar) will indicate whether products of a higher sugar content are priced higher than products that have a lower sugar content. The %Sugar is also a control variable given there is a diverse panel of SCPs considered in the analysis. It is uncertain whether more highly sweetened products are priced higher or lower (Table 1).
Product weight has been shown to affect pricing decisions of foods (Ghazaryan et al., Reference Ghazaryan, Westgren, Parcell and Gedikoglu2018). To incentivize sales volume, manufacturers may increase a product’s package size, which decreases the SCP price per unit, and in consequence, makes their products economically more attractive. It has also been suggested that sugar-using firms may increase price per unit by repacking candy into smaller bars sold at similar prices (Trejo-Pech et al., Reference Trejo-Pech, DeLong, Lambert and Siokos2020), a phenomenon known as “shrinkflation” (National Public Radio, 2021). Decreasing the size of the candy bars without decreasing their price proportionally would have the impact of increasing the SCP price per pound. From a more general standpoint, product Weight is also included as a control variable since the data are a panel of SCPs ranging from candy bars to sucrose-sweetened soft drinks and it is likely SCP prices vary by product types which also have different weights. Given these relationships between SCP weight and price per pound, we expect that as the package size increases (decreases), the SCP price per pound will decrease (increase) (Table 1).
Firm Size and Past Financial Performance
Hedonic pricing modeling improves when in addition to cost and demand considerations (i.e., package size, sugar content, and sugar price), aspects of the brand’s marketing strategy, such as a firm’s competitive positioning, are included as explanatory variables (Rao, Reference Rao1993). Furthermore, the competitive structure and market power of a firm are an important determinant of food prices (Hamilton, Liaukonyte, and Richards, Reference Hamilton, Liaukonyte and Richards2020; Richards, Hamilton, and Yonezawa, Reference Richards, Hamilton and Yonezawa2017). Thus, the firm’s sales growth, past financial performance, and size proxies are considered in this study to control for a firm’s competitive positioning.
Sales growth is one of the most preferred financial ratios used by equity analysts issuing investment recommendations on publicly traded firms’ stocks (Trejo-Pech, Noguera, and White, Reference Trejo-Pech, Noguera and White2015). Firms in the sample would likely consider sales trends when pricing their products. It is hypothesized that one-quarter lagged year-to-year sales growth (SalesGrowth) will positively influence pricing decisions in the current quarter (Table 1). It is plausible that when sales are growing, firms may increase prices to test whether consumers are still willing to pay higher prices (i.e., positive sales growth may signal underpricing). In contrast, when sales are decreasing, firms may decrease prices to incentivize purchasing and avoid further sales growth deterioration.
Publicly traded firms’ profitability is highly scrutinized every quarter by equity analysts and investors because profitability and market equity value are directly related. Consistently, surveyed chief financial officers (CFOs) rank earnings as the single most important financial metric they care about. Further, CFOs have strong incentives to meet or exceed earnings thresholds (Graham, Harvey, and Rajgopal, Reference Graham, Harvey and Rajgopal2006). Failure to meet capital market’s earnings thresholds may place firms under financial pressure. Trejo-Pech, Weldon, and Gunderson (Reference Trejo-Pech, Weldon and Gunderson2016), for instance, find that publicly traded agribusinesses failing to meet earnings thresholds tend to manipulate earnings to get back on track, suggesting that earnings thresholds could be as important or more important than the value of reported earnings itself. For empirical research, Gunny (Reference Gunny2010) and Zang (Reference Zang2012) operationalize earning thresholds by comparing firm current and previous period reported earnings ratios, as specified below. It is hypothesized that not meeting earnings thresholds on a given quarter influences the SCP pricing decision in the following quarter. However, it is difficult to predict the direction of price changes firms may create to increase profits because it would depend on margin levels, non-recurrent expenses during the current quarter, or product-price elasticities, among other factors. Following Zang (Reference Zang2012), we build a binary earnings threshold variable with a value of one for firms that reported lower earnings per share (EPS) relative to the previous quarter or barely higher EPS relative to the previous quarter. Specifically, we define EPSthreshold
t = 1 if EPSt−1/EPSt−2 ≤ 1.01, 0 otherwise.Footnote
3
This lagged EPS threshold (EPSthreshold) is expected to affect pricing decisions either positively or negatively in the current period (Table 1).
Larger firms might be better positioned than smaller firms for pricing decisions and price negotiations with retailers since they might afford higher advertising expenditures, better trained sales force, higher R&D, and in general, have larger resources. Given the documented effect of firm size on stock returns (Banz, Reference Banz1981; Fama and French, Reference Fama and French1993), firm size is widely used as a control variable in finance-related research. Thus, it is hypothesized that large firms—size measured in terms of market value—will be more likely to exercise their market power and have higher SCP prices than small- and medium-sized firms (Table 1). Therefore, we include a variable regarding the size of the firm relative to other firms in the sample (LargeMarketVal). LargeMarketVal is a binary variable equal to one if a firm ranked in the top 33% of firm market value sizes of all firms in the sample and zero otherwise. Firm market value size is defined as total assets minus common equity plus market capitalization, where market capitalization equals the stock price multiplied by the number of shares outstanding during the fiscal quarter.
Macroeconomic Conditions
Two macroeconomic variables (ME), disposable income (DispIncome) and recessionary periods (Recessions), are used to control for general economic factors that affect the economy on a large scale and could potentially influence SCP prices. DispIncome is per capita disposable income, which is defined as an individual’s personal income minus their taxes (Bureau of Economic Analysis, 2021). As per capita disposable income increases, this indicates that price levels elsewhere may also be rising, such as retail SCP prices. It also may indicate sugar-using firms are motivated to increase their prices since consumers should be able to afford the price increase. The inclusion of this variable is similar to Volpe, Risch, and Boland (Reference Volpe, Risch and Boland2017), who controlled for mean family income in their model of food price changes, and Richards and Hamilton (Reference Richards and Hamilton2015), who included grocery employee average wages in their model examining the passthrough effects of food prices. It is hypothesized that as per capita disposable income (DispIncome) increases, SCP prices will increase as well. The macroeconomic condition of recessions (Recessions) was used to account for trends in gross domestic product (GDP). A recession is defined as two consecutive quarters of decline in real GDP. If the US was in an economic recession according to the National Bureau of Economic Research (2021), Recessions was equal to one (and was zero otherwise). It is hypothesized that SCP prices will be lower in a recession to entice consumers to still purchase SCPs.
Econometric Model
A fixed-effects panel regression was estimated to determine factors influencing SCP prices. The panel consists of a sample of SCPs sold by sugar-using publicly traded firms over time. The dependent variable is SCP price per pound (SCPprice) expressed in 2020 Consumer Price Index (CPI) adjusted dollars (U.S. Bureau of Labor Statistics, 2021). This was calculated by dividing SCP CPI adjusted prices by the total pounds in each product’s package. Expressing SCP price on a per pound basis standardizes prices across product categories and uses the same units for both output and input prices (i.e., sugar prices are by industry convention expressed in $ per pound). This model specification is similar to Ghazaryan et al. (Reference Ghazaryan, Westgren, Parcell and Gedikoglu2018) who estimated a hedonic pricing model with produce prices as the dependent variable and included independent variables related to produce characteristics.
SCP price is modeled as a function of SCP characteristics, firm size, firm past financial performance, and macroeconomic conditions. Equation(2) shows the model:

$$\eqalign{\ln (SCPprice)_{i,t}^{SCP} = {\beta _0} + {\beta _1}\cdot\ln (Weight)_{i,t}^{SCP} + {\beta _2}\cdot\ln (\% Sugar)_{i,t}^{SCP} \cr \,\,\,\,\,\,\,\,\,\,\,\,\,\,\,\,\,\,\,\,\,\,\,\,\,\,\,\,\,\,\,\,\,\,\, + {\beta _3}\cdot\ln (SugarPrice)_{i,t}^{SCP} + {\beta _4}\cdot SalesGrowth_{i,t – 1}^F + {\beta _5}\cdot EPSthreashold_{i,t – 1}^F \cr \,\,\,\,\,\,\,\,\,\,\,\,\,\,\,\,\,\,\,\,\,\,\,\,\,\,\,\,\,\,\,\,\,\,\, + {\beta _6}\cdot LargeMarketVal_{i,t}^F + {\beta _7}\cdot\ln (DispIncome)_{i,t}^{ME} + {\beta _7}\cdot R_{i,t}^{ME} + {a_i} + {e_{i,t}} \cr} $$
where subscript i represents the uniquely identified SCP, t is a calendar quarter, and superscripts represent characteristics associated with the SCP (SCP), SCP firm (F), and macroeconomic conditions (ME). SCP characteristics include SCP weight (Weight), the percentage of sugar in the SCP (%Sugar), and the four considered sugar prices (SugarPrice) which were adjusted for inflation using the CPI. To facilitate the interpretation of results (i.e., have parameters estimated as elasticities), the natural log (ln) of the SCP characteristic variables and disposable income was used in equation(2).
SCP firm size and financial performance variables include sales growth (SalesGrowth), the EPS threshold proxy (EPSthreshold), and the variable regarding the size of the firm relative to other firms in the sample (LargeMarketVal). The macroeconomic variables of per capita disposable income (DispIncome) and recessions (Recessions) were also included. DispIncome was adjusted for inflation using the CPI and the natural log of DispIncome was used in the model. Complete variable descriptions appear in Table 1. a
i
in equation(2) captures product-specific fixed effects.
From equation(2), the null hypothesis of whether sugar prices affect retail SCP prices

$({\beta _3} = 0)$
can be tested. If the null is failed to be rejected, then sugar prices do not have a relationship with SCP prices. Meanwhile, if the null hypothesis is rejected

$({\beta _3} \ne 0)$
, then sugar prices do affect SCP prices. Equation(2) is estimated under four specifications of SugarPrice to test the null hypothesis. In the first specification, SugarPrice is the quarterly sugar price, and in the second specification, SugarPrice is the one-quarter lagged sugar price, relative to the time-period SCP prices were collected. This was done to determine whether SCP prices are based on current sugar prices or previous (lagged) sugar prices. If sugar prices do affect SCP prices, it is likely they do not instantly change.Footnote
4
Thus, it is suspected that any relationship between sugar prices and SCP prices would be lagged by one-quarter. To keep the notation simple, equation(2) shows only the current price specification.
In the third sugar price model specification, SugarPrice is the US-to-world sugar price ratio and in the fourth specification it is the quarterly lagged US-to-world price ratio. This follows a similar approach to Trejo-Pech et al. (Reference Trejo-Pech, DeLong, Lambert and Siokos2020). The sugar relative price coefficient, β
3, is expected to be either positive or non-significant. A positive coefficient will imply that US sugar-using firms will increase prices whenever they find themselves in a competitive disadvantage relative to firms that can obtain sugar at world prices. This may occur in the following instances on which the US-to-world price ratios increase: when both US and world sugar prices increase but the US sugar price increases at a higher rate, when both US and world sugar prices decrease with US sugar prices decreasing at a lower rate, and in general when any combination of US and world sugar price changes increase the US to world sugar price ratio. Alternatively, the US-to-world sugar price coefficient will be zero if US sugar prices represent such a small percentage of SCP prices that US sugar firms do not make SCP pricing decisions based on sugar input price changes, regardless the relationship between US and sugar world prices.
To estimate the panel fixed-effects regression in equation(2), the xtreg command in Stata with the fe specification was used (StataCorp, 2017). The regression was estimated accounting for heteroscedasticity and contemporaneous correlation of the error terms through the vce(robust) command in Stata. This specification was used since the results of the xttest3 command (Baum, Reference Baum2001) provided a rejection of the test’s null hypothesis which means the error terms exhibited groupwise heteroscedasticity. The vce(robust) command results in the Huber/White/sandwich variance–covariance estimation (vce) estimator to be calculated for the regression coefficients (StataCorp, 2021). The coldiag2 command in Stata was used to determine if multicollinearity was an issue. If the estimated condition indexes for the variables are less than 30, the regression is considered free of collinearity issues (Belsley, Reference Belsley1991).
Data
Starting in 2008, the ASA created an annual database of SCPs. To qualify as a SCP, the product had to contain sugar (sucrose) as a primary ingredient (be at least the fifth listed ingredient on the product’s label) and the product had to contain at least 10% sugar by product weight. Sugar in this analysis is limited to sucrose; for example, soft drinks in this data set include only those made with real sugar (sucrose) and do not include those sweetened with high fructose corn syrup (HFCS). Annually (typically in June), the ASA collects data from grocery stores in the metropolitan Washington, D.C. area on a variety of SCPs. They collect the SCP prices as well as information from the respective products such as the product’s net weight and information from the nutritional facts panel such as serving size, servings per container, and grams of sugar per serving. Previous research has also used hand-collected data to estimate the passthrough effects of taxes on sugar-sweetened beverages (Cawley et al., Reference Cawley, Frisvold, Jones and Lensing2021).
For this analysis, only publicly traded companies with available financial accounting and stock price data in the Wharton Research Data Services (WRDS) database were analyzed since firm financial performance was controlled for in the analysis. Firm financial data were obtained specifically from WRDS’s Compustat Capital IQ Fundamentals Quarterly module, with the following items used to calculate financial variables in the model: total assets, total revenue, total equity, stock price, number of shares outstanding, and EPS. Thus, there is a panel of data by firm and SCP type ranging from 2008 through 2020 with the exception of 2011 when the ASA did not collect data.
The complete list of SCPs in the analysis, by firm and by year, appears in Appendix A. The firms in the analysis, and examples of their SCPs in the panel, are the following: Tootsie Roll (Junior Mints), The Hershey Company (e.g., Milk Duds, Hershey Bar, Hershey Bar with Almonds), Unilever (e.g., Klondike bars, Ben and Jerrys ice cream), The J.M. Smucker Company (e.g., Pillsbury cake and frostings), Pinnacle Foods and Conagra (e.g., Duncan Hines frosting and cake mixes), PepsiCo, Inc. (e.g., Pepsi Throwback, Quaker corn bread), Mondelez (e.g., Oreos), Kraft (Jello-O), and General Mills (e.g., Betty Crocker cake mixes and frostings). Appendix A also shows summary statistics by SCP firm (Table A1).
Summary statistics for the variables used in equation(2) appear in Table 2. There are a total of 379 observations in the sample. SCP prices were collected directly from the SCPs appearing in the grocery stores and, for this study, were adjusted for inflation using the CPI series published by the U.S. Bureau of Labor Statistics (2021) with August 2020 as the base year (i.e., the last month SCP prices were collected in the database). SCP price was then standardized by dividing it by the SCP’s net weight (in pounds). This is the dependent variable in the analysis, SCPprice. The average SCP price per pound (SCPprice) was $6.22/pound with a minimum price of $0.55/pound (Pepsi Throwback and Mountain Dew Throwback) and a maximum price of $17.95/pound (Hershey York Peppermint Pattie) (Table 2).
Sugar-Containing-Product Characteristics
The model was estimated using four SugarPrice specifications as shown in Table 1. The US wholesale refined beet sugar prices were considered for analysis, and they were adjusted for inflation using the CPI.Footnote
5
The US wholesale refined beet sugar price was utilized since this is the industry conventional benchmark for wholesale refined sugar dating back to 1960 (USDA ERS, 2021b). To construct the US-to-world sugar price ratio, the US wholesale refined beet sugar price was divided by the world wholesale refined sugar price.Footnote
6
Both prices were adjusted for inflation using the CPI.
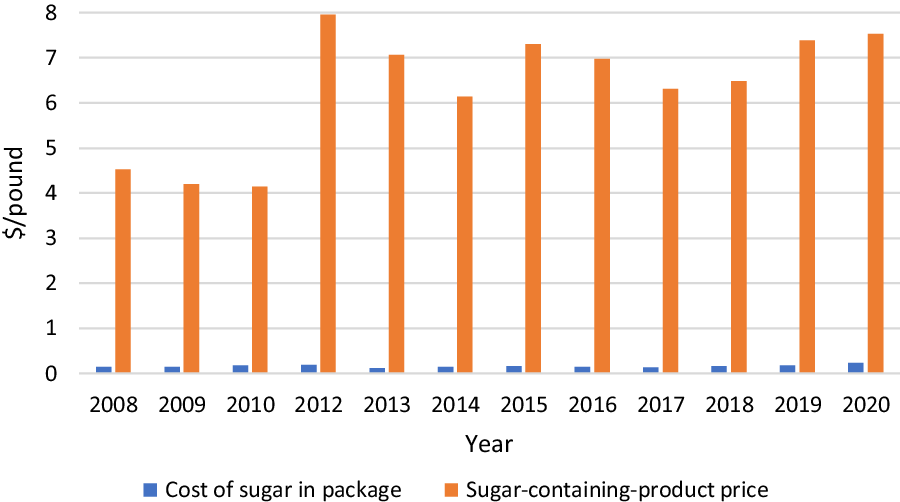
Equation(2) was estimated using four SugarPrice specifications (i.e., US contemporaneous and lagged sugar prices, and US-to-world contemporaneous and lagged price ratios). Both wholesale refined beet sugar prices averaged around 33 cents/pound and ranged from around 23 cents/pound to 44 cents/pound. Both US-to-world sugar price ratios averaged around 1.8 with the lowest being 1.2 and the highest being 2.7. Figure 1 shows the annual relationship of wholesale refined beet sugar prices per pound and SCP prices per pound as well as the percentage of sugar in each product. As shown by Figure 1, sugar prices represent a small percentage of the SCP price.
Annual SCP prices, sugar prices, and sugar share of SCP weight.

The percentage of sugar (%Sugar) in each SCP was calculated from the weight of sugar in the product provided on the nutritional facts panel (in pounds) divided by the SCP weight provided on the package label (in pounds). The average percentage of sugar in SCPs was 48%, the minimum was 12% (Pepsi Throwback), and the maximum was 99% (Tootsie Roll Junior Mints). The SCP weight (Weight) is equal to the net weight of the SCP, which is found on the package of the SCP. The average weight was 1.17 pounds with the minimum SCP weight being 0.086 pounds (General Mills Betty Crocker muffin and quick bread mix-cinnamon streusel) and the maximum SCP weight being 9 pounds (Pepsi Throwback and Mountain Dew Throwback).
Sugar costs in the package per pound (SugarCostPackage) were also computed by multiplying %Sugar by the quarterly SugarPrice.
Footnote
7
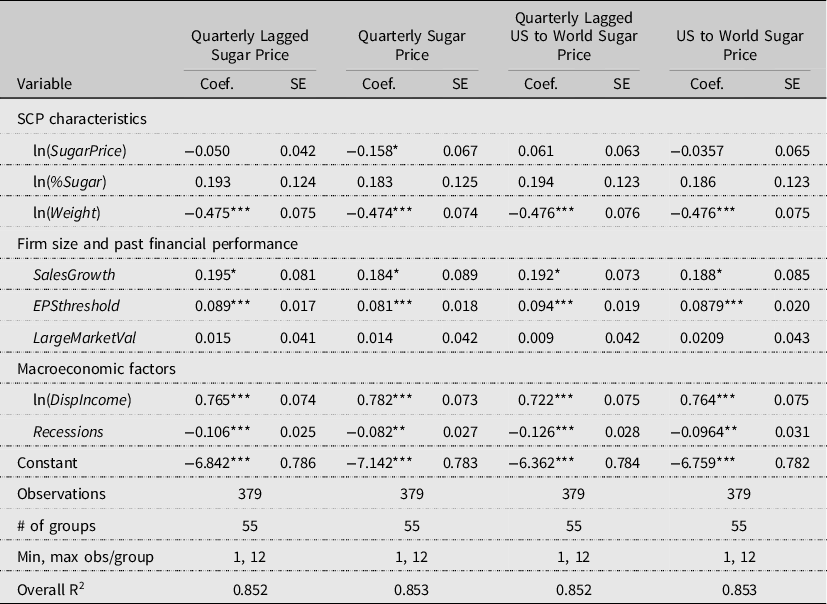
The average cost of sugar across all SCPs was 15.9 cents/pound, with a maximum of 44 cents/pound (Tootsie Roll Junior Mints) and a minimum of 2.7 cents/pound (Pepsi Throwback) (Table 2). Meanwhile, the average SCP price is $6.22/pound. Thus, the percentage of the cost of sugar across SCPs is only 2.56% of the total SCP price despite the fact that sugar consists of 48% of the SCP’s weight. Figure 2 shows this relationship from 2008 to 2020.
Cost of sugar in the sugar-containing-product (SCP) versus the SCP price.
Firm Size and Past Financial Performance
Sales growth (SalesGrowth) was calculated by first accumulating last-trailing-twelve-months (LTTM) revenues per quarter and then applying the formula (LTTM revenuest−1/LTTM revenuest−5)−1. The average one-quarter lagged annual sales growth for the firms in the sample was 3.1%. The lowest sales growth was −13.1% (Mondelez) and the maximum sales growth was 114% (Kraft).
EPS threshold (EPSthreshold) was calculated as in Zang (Reference Zang2012), EPSthreshold
t is equal to one if EPSt−1/EPSt−2 ≤ 1.01, and zero otherwise, with the 12-months-moving-average basic EPS excluding extraordinary items, reported by Standard and Poor’s in the WRDS database. The average EPS threshold was 39% with the minimum being zero for several companies and the maximum being one for several companies. The LargeMarketVal was equal to 35%. The average firm market valuation was $5.5 billion with the smallest being $1.5 billion (Tootsie Roll Industries) and the largest being $270 billion (PespiCo Inc.) (Table 2).
Macroeconomic Conditions
Per capita disposable income (DispIncome) was adjusted for inflation using the CPI. On average, DispIncome was $39,334 with the lowest being $29,440 and the highest being $53,261. The US was marked as being in an economic recession from the fourth quarter of 2007 through the second quarter of 2009 and in 2020. On average, 17% of the SCP sample was collected during a recession (Table 2).
Results and Discussion
Table 3 shows the results of estimating equation(2) using the four different SugarPrice specifications using all SCPs. Since ice cream and soft drinks were heavier (Weight), equation(2) was also estimated excluding ice cream and soft drinks (Table 4). Multicollinearity was not an issue in any of the model specifications as the Condition Indexes for all the variables were less than 24 and anything under 30 is considered free of collinearity issues (Belsley, Reference Belsley1991). All models had high R
2
values of 0.85 in Table 3 and above 0.80 in Table 4. Since the results in Table 4 are very similar to Table 3, we primarily discuss only the results in Table 3.
Panel fixed-effects regression results using quarterly lagged and quarterly sugar prices
Panel fixed-effects regression results using quarterly lagged and quarterly sugar prices and excluding ice cream and soft drinks

Sugar-Containing-Product Characteristics
The coefficient on SugarPrice when considering quarterly lagged wholesale refined sugar prices, quarterly lagged US-to-world sugar prices, and US-to-world sugar prices is not significant.Footnote
8
Thus, there is no evidence that sugar prices are associated with SCP prices, and we fail to reject the null hypothesis that β
3 = 0 and conclude that sugar prices do not affect SCP prices. A possible explanation of why there is no statistically significant relationship between US sugar prices and US SCP prices is that US sugar costs represent a small percentage of US SCP prices (i.e., only 2.56% in this sample) despite being a large portion of the SCP’s weight (48% in this sample). However, when considering quarterly wholesale refined sugar prices, there is a negative and statistically significant relationship (p < 0.05) between sugar prices and SCP prices. This is the opposite of expectations and would indicate that as sugar prices increase, SCP prices actually decrease, ceteris paribus.Footnote
9
To investigate this further, we look to the results when we exclude soft drinks and ice cream from the analysis (estimating the model with more similar SCPs by weight). Under that model, this relationship no longer exists (Table 4).
Together, these results indicate that higher US sugar prices and higher relative sugar prices (compared to world sugar prices) do not result in increased SCP prices. This means there is no evidence to suggest that higher sugar prices are passed onto consumers through higher SCP prices when other factors are accounted for. The lack of a positive relationship refutes the SUA (2021) claims that US sugar policy causes sugar-using firms to pass on high costs of US sugar to consumers.
The percentage of sugar in the SCP (%Sugar) also did not have a statistically significant relationship with SCP prices. This is further evidence that characteristics related to the cost of sugar in the SCP have no effect on SCP prices. Despite critics of US sugar policy claiming high US sugar prices negatively impact consumers (SUA, 2021), it is hard to justify this allegation when sugar costs represent such a small fraction of SCP prices despite being a primary ingredient (Triantis, Reference Triantis2016; ASA, 2021). Similar to previous studies (Triantis, Reference Triantis2016; ASA, 2021), this study found that the cost of sugar in SCPs was only 2.56%. This is likely a rationale for why there was no statistically significant association between SCP prices and sugar prices (SugarPrices) or the percentage of sugar in the SCP (%Sugar).
Consistently across all model specifications, Weight was negative and significant (p < 0.001) (Table 3). As predicted, as the weight of the package increased, the SCP price per pound decreased. Across both sugar price specifications, if SCP weight increased by 10%, SCP price per pound decreased by 4.8%. It was hypothesized that this result could either be due to “shrinkflation” or simply because heavier products are cheaper per pound. By evaluating Table A1 in the appendix and micro-analyzing the raw data, it is apparent that within this data set, the results are likely driven by larger products (e.g., Pepsi Throwback, Oreos, Ice Cream) being cheaper per pound and weighing more than candy (e.g., Tootsie Roll, Hershey candy). From analyzing the raw data, it also appears that within this SCP data set products did not “shrink” over time. However, future research could find data where this phenomenon took place and investigate this issue further.
Firm Size and Past Financial Performance
For all model specifications, as expected, an increase (decrease) in lagged sales growth (SalesGrowth) increases (decreases) current SCP prices. Across all sugar price specifications in Table 3, a 10% increase in sales growth increases SCP prices by about 2% (p < 0.01). It is possible that firms make SCP pricing decisions based on recent sales growth performance. That is, firms increase SCP prices when sales positively grow, to test whether consumers are still willing to pay higher prices, and decrease prices when sales decline, to incentivize purchasing and avoid further sales growth deterioration. SCP firms ranked at the top 33% of firm market value size (LargeMarketVal) did not price SCPs differently. This indicates that market power does not affect pricing strategies.
Across all sugar price specifications, SCP prices increase following a quarter when firms do not meet their EPS thresholds (ESPthreshold) (i.e., when lagged EPS is lower or barely higher relative to the previous quarter’s EPS) (p < 0.001). This is expected as EPS in publicly traded firms is highly scrutinized by equity analysists and EPS growth is rewarded by investors. Indeed, financial managers recognize that earnings are the single most important financial metric they care about. This result suggests that not meeting the EPS threshold might put firms into temporarily financial distress causing them to increase SCP prices to increase profits.
Macroeconomic Conditions
As expected, as disposable income increases, SCP prices also increase (p < 0.001). As disposable income increases by 10%, SCP prices increase by around 7–8%. Results also suggest that SCP prices tend to be lower during economic recessions (Recessions), as expected. This indicates that sugar-using firms consider the demand for SCPs as somewhat elastic since both macroeconomic variables affect SCP prices (e.g., when in a recession SCPs are lower and when disposable income rises, they increase).
Conclusions and Policy Implications
US sugar policy regulates the amount of sugar domestic producers are allowed to market and the amount of sugar foreign countries are allowed to export to the US. This is done to buffer domestic producers against subsidized foreign sugar that depresses the world market price to levels well below world average sugar production costs (LMC International, 2021). This results in US sugar prices generally being higher than world sugar prices, opening the possibility that sugar-using firms pass these higher sugar costs onto consumers. Therefore, this research estimated a traditional hedonic pricing model using a unique data set to determine if US sugar prices are associated with SCP prices. This is the first known research to estimate the factors that influence SCP prices, which is important given SCPs represent a multibillion-dollar sector of the economy.
Results found that firm sales growth, firm historical EPS, SCP weight, and macroeconomic conditions were all statistically significant in determining SCP prices. However, it was not found that higher sugar prices or higher relative sugar prices (to the world) were associated with increased SCP prices. A possible explanation of why US sugar prices are not related to SCP prices is that among the SCPs in this sample, the average cost of sugar was only 2.56% of its total product price despite sugar representing nearly half of the SCP’s weight. The discovery that the commodity (sugar) value of the SCP is insignificant is consistent across other food groups (USDA, 2021c). For example, in 2019 it was estimated that farmers received only 14.3 cents from a typical dollar of food purchased (USDA, 2021c). In comparison, a sugar farmer receives even less than this amount from a typical dollar of a SCP purchased.
In terms of policies surrounding the sugar market, it is fascinating that on one end of the spectrum, critics contend US sugar prices are too low, which encourages overconsumption of SCPs and in turn contributes to the obesity epidemic (New York University, 2019). Those researchers suggest SCPs should be taxed to increase SCP prices and discourage SCP consumption (New York University, 2019). The literature on SCP taxes is vast and examines the passthrough effect of taxes on SCPs and the questionable effectiveness of taxes on decreasing consumption of SCPs (e.g., Cawley et al., Reference Cawley, Frisvold, Jones and Lensing2021; Lee et al., Reference Lee, Falbe, Schillinger, Basu, McCulloch and Madsen2019; Allcott, Lockwood, and Taubinsky, Reference Allcott, Lockwood and Taubinsky2019). On the other end of the spectrum, other critics contend US sugar prices are unfairly high and US companies should have better access to the world sugar market (SUA, 2021). Those companies argue that higher sugar prices are “unfairly” passed on to consumers (SUA, 2021).
We examine that declaration by being the first known research to estimate a hedonic pricing model of SCP prices. It was found that while several factors contribute to SCP prices, the percentage of sugar in the SCP and sugar prices (whether lagged, contemporaneous, or relative to world prices) did not have a positive and statistically significant impact on SCPs. Thus, sugar-using firms are not sensitive to US sugar price variation when pricing SCPs. Instead, those firms consider other SCP characteristics, their firm financial position, and macroeconomic conditions when pricing their products. This study ultimately concludes that US sugar policy does not negatively affect sugar-using firms.
Future research should further investigate the commodity value of the food dollar across various commodities and the transmission of commodity prices to food prices. It is important for farmers, policy makers, and consumers to understand what percentage of retail prices are attributable back to the farm, since this message likely resonates with the public. Furthermore, some agribusiness firms are characterized as having market power. Thus, future research should continue to consider firm size and financial performance in their analysis of food prices similar to this study. The results of this study are beneficial to sugar beet and sugarcane farmers as they begin their campaign to support current US sugar policy in the upcoming Farm Bill since this study shows that while sugar is an important, and many times the majority component of SCPs, it represents, on average, less than 3% of the SCP price. Furthermore, findings show that sugar’s price changes, whether higher or lower, have no effect on prices retail consumers pay for SCPs, from cake mixes to soft drinks to candy bars.