

Bitcoin traded near $64,270 on Aug. 5, gaining less than 1% as record equity markets and falling oil prices failed to produce a broad crypto rally.
Summary
- Bitcoin price held above $64,000 while record global equities and cheaper oil failed to spark momentum.
- Brent fell near $78.50 as traders awaited a possible U.S., Iran, and Oman shipping agreement.
- Bitcoin must close above $64,300 on four hour charts to confirm analyst Ali Martinez’s breakout.
- Bollinger Bands place immediate resistance near $66,285 and range support around $62,524 for Bitcoin traders.
- U.S. spot Bitcoin ETFs drew $19.6 million Tuesday, but recent outflows still weighed on demand.
The largest cryptocurrency remained roughly flat over seven days and about 49% below its October 2025 record above $126,000.
Ether and XRP weakened, while BNB and Hyperliquid’s HYPE outperformed among major tokens. The restrained response contrasted with global stocks, where the S&P 500 and Dow closed at records and Asian technology shares rose sharply on strong AI related earnings.
Bitcoin price sits out the latest risk rally
Reuters reported that Japan’s Nikkei gained 3.5%, South Korea’s benchmark rose 4.3%, and an MSCI Asia Pacific gauge excluding Japan advanced 2.3%. Brent crude fell toward $78.85, while the U.S. 10 year Treasury yield eased to about 4.603% as traders reduced expectations for another near term Federal Reserve rate increase.
Those conditions would normally offer support to BTC. Cheaper oil can reduce inflation pressure, while lower bond yields can make non interest bearing assets more attractive. Yet BTC has shown only a limited response across several sessions, suggesting crypto specific demand remains too weak to confirm a wider risk rally.
U.S. spot Bitcoin exchange traded funds recorded $19.6 million of net inflows on Aug. 4, according to Farside Investors. The positive session offered some support, but it followed a period of heavier withdrawals, including about $265 million reported on Aug. 1.
Corporate supply has also returned to the market. Strategy’s official Bitcoin ledger shows the company sold 1,638 BTC for about $105 million, leaving it with 842,138 BTC. The sale was small relative to its holdings, but it removed a source of price insensitive accumulation that had supported earlier rallies.
A Hormuz agreement remains possible, not confirmed
Axios reported that the U.S., Iran, and Oman were approaching a temporary arrangement to reopen the Strait of Hormuz, with an announcement targeted for Wednesday. The proposal would create a 60 day shipping arrangement that could be extended. President Donald Trump later said a deal could arrive Wednesday or Thursday.
No signed agreement had been announced at the time of reporting. Trump described the discussions as “very good,” while Iran and the U.S. still differed on key details. The market therefore remains exposed to another breakdown after an earlier arrangement collapsed and attacks on shipping resumed.
Oil has already priced in part of the expected easing in tensions. The largest crypto has recovered by more than $2,000 from its recent low near $62,200, but the move remains modest compared with the response in equities and crude. A confirmed agreement may reduce a major inflation and geopolitical risk, although it would not guarantee fresh crypto demand.
The crypto rose toward $66,800 after an earlier Hormuz reopening announcement in June.Renewed conflict could expose support below $64,000. The contrast makes the next confirmed diplomatic update a useful test of whether Bitcoin still reacts strongly to the oil and rates channel.
Bitcoin needs $64,300 to confirm a breakout
The supplied four hour setup places $64,300 at the upper boundary of a descending channel. Analyst Ali Martinez said a close above that level “could confirm the breakout” and open a possible move toward $65,500 or $66,500. Those levels are conditional targets, not confirmed outcomes.
The daily chart gives a more cautious reading. The crypto trades near the Bollinger Bands middle line around $64,404. The upper band sits near $66,285, while the lower band is around $62,524. This structure shows consolidation rather than a completed directional move.
The Aroon Oscillator stands at negative 71.43, showing recent lows remain more dominant than recent highs. Holding $62,500 to $63,000 would preserve the range, while a daily move above $66,000 to $66,300 would provide stronger evidence that buyers have regained control.
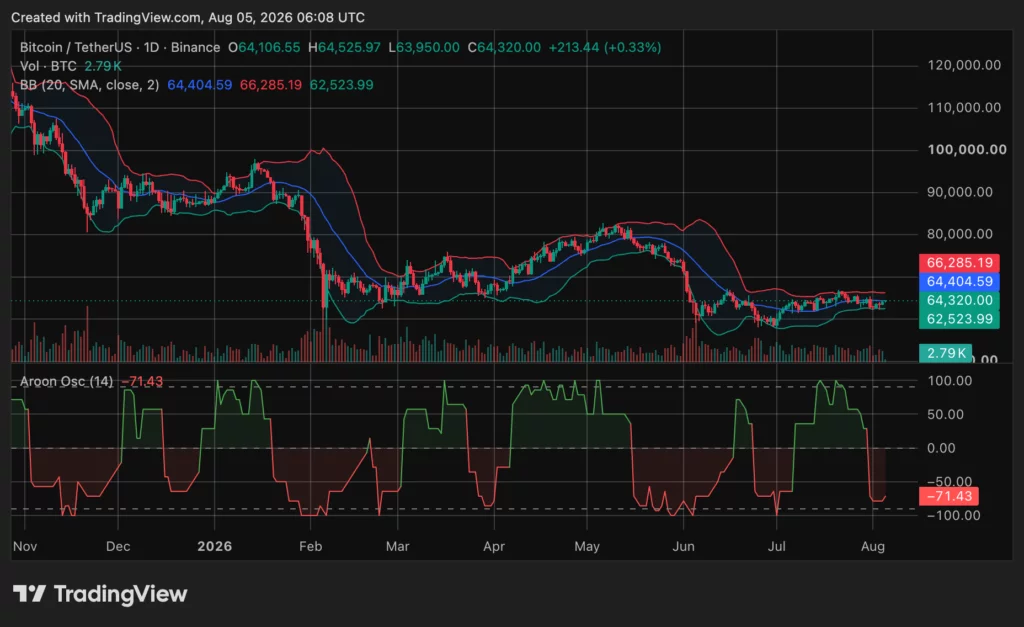
Meanwhile, the next market test is whether a confirmed Hormuz agreement can push the crypto above $64,300 and then through the upper Bollinger Band. Failure to rally after a verified deal would strengthen the view that capital is favoring AI shares, bonds, and gold rather than crypto.
Traders will also watch ETF flows, the $62,500 lower range, and whether Strategy reports further sales. Until volume expands and BTC closes above resistance, the rebound from $62,200 remains a recovery inside a broader downtrend rather than a confirmed trend reversal.
FAQs
Why is Bitcoin lagging behind global stocks?
Bitcoin lacks strong crypto-specific demand despite favorable macro conditions. Record stock prices, falling oil and lower bond yields have not produced enough buying pressure to confirm a breakout. Recent ETF inflows have also remained modest compared with earlier withdrawals.
What is the key Bitcoin price level to watch?
The immediate level is $64,300, which marks the upper boundary of the descending channel on the four-hour chart. A confirmed close above it could support a move toward $65,500 and $66,500, although those targets remain conditional.
Could a Strait of Hormuz agreement lift Bitcoin?
A confirmed agreement could reduce geopolitical and inflation risks by improving shipping conditions and lowering oil prices. However, it would not guarantee a Bitcoin rally. A weak response could indicate that investors currently prefer equities and other assets.
What are Bitcoin’s main support and resistance levels?
Immediate support sits between $62,500 and $63,000. A break below that range could expose the recent $62,200 low. Resistance appears at $64,300, followed by the upper Bollinger Band near $66,285.
What would confirm a stronger Bitcoin recovery?
Bitcoin would need stronger trading volume, sustained ETF inflows and closes above $64,300 and $66,300. Until then, the move from $62,200 remains a rebound within a broader downtrend rather than a confirmed reversal.