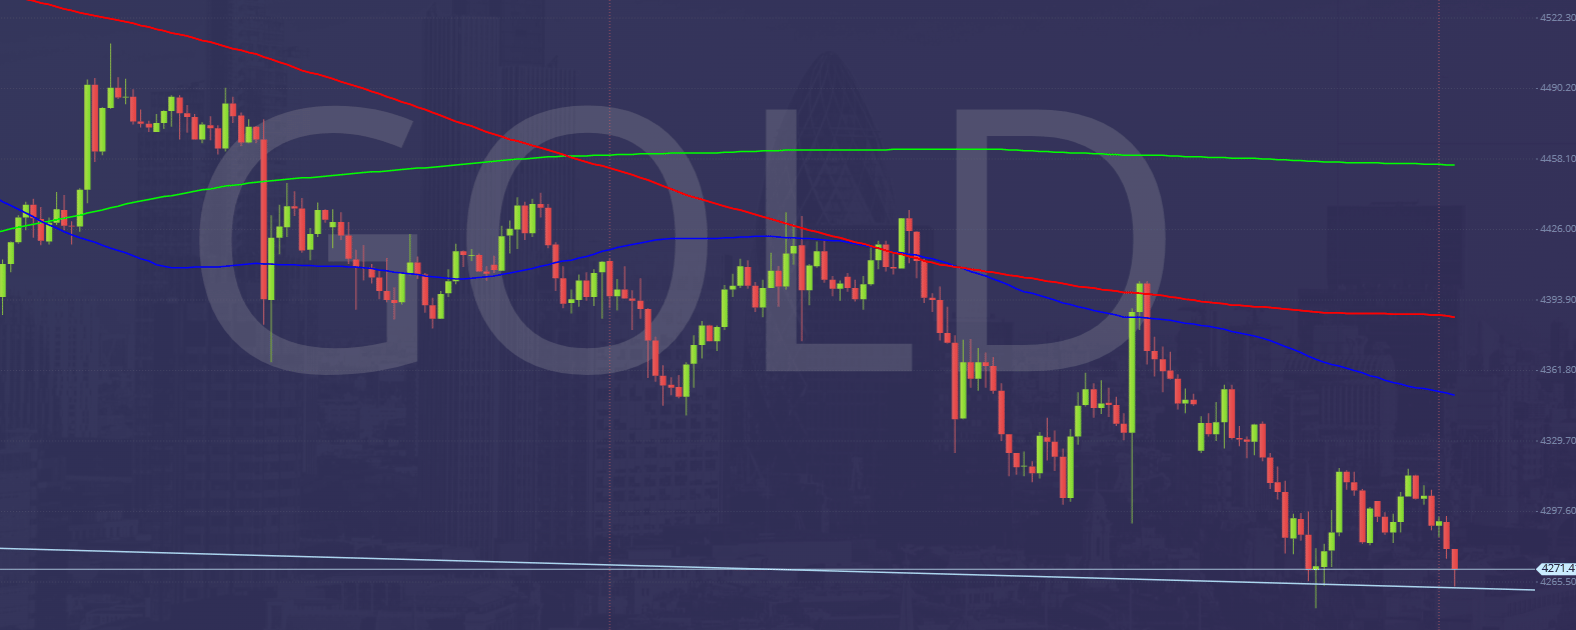
Gold
Gold held inside of the previous week’s range all through last week.
In fact gold only had a range of $150 last week & so far this month we have moved about 25% of the range in August.
This week’s key risk is not just the Fed decision—it’s the dot plot and Chair Warsh’s guidance. A hike plus signals of another move in December could strengthen the dollar and pressure gold, silver and equity valuations.
for the last two weeks we are averaging moves of around $60 before reversing during the day.
so again for this week we have to keep things tight, taking quick profits whenever we see them
We are still trading exactly where we were 5 or 6 weeks ago, and as far back as October 2025, when we reached a peak of 4381, (and we trading trading $70 below here today) so there is no longer term trend or pattern to guide us at this stage.
HOWEVER we are holding a 3 week bear trend.
it seems everybody’s talking about a head and shoulders pattern in gold and I don’t see it as relevant.
a head and shoulders pattern is only relevant after a sustained bull run and we certainly haven’t seen that.
if retail traders are short expecting the head and shoulders pattern to complete, it could create a short squeeze and push gold higher when the rate decision is announced tomorrow.
this is not the basis for any trades but something I just wanted to note.
Gold hovered around the 4335 for about three hours until mid-morning then continued lower too hit my targets of 4328, 4315/ 4312 & retest the September lows at 4300/4283.
we broke below here and collapsed yesterday to 4254, breaking below a very minor 10 Day descending trend line at 4285/80, but as has been typical of the recent trend, it was a false move and gold quickly recovered.
In fact on the 4 hour chart we even posted a bullish engulfing candle to negate the bearish signal.
It remains tough to trade this mostly sideways market.
Since the bullish engulfing candle formed, there has been no follow through to the upside and we have just traded sideways through the evening and overnight.