Gold’s upward direction seems to have survived Trump’s inauguration yesterday and there do not seem to be any major financial releases from the US that could shake gold’s price until our next report hence we are to focus on gold’s fundamentals for direction in the current report. For a rounder view, we conclude the report with a technical analysis of gold’s daily chart.
Trump’s inauguration allows for Gold’s price to rise
Trump’s inauguration held only few surprises for the markets yesterday. Overall given the flamboyant style of the US President which the markets are accustomed to, the inauguration speech besides the usual mantra, may have been somewhat moderated. We do note his intentions to crack down on immigration, pardons for January 6th rioters, the reversal of initiatives for gender and race and highlight for market purposes two other issues. The first would be Trump’s intentions to maximise oil and natural gas production and the second his intentions to apply tariffs on Mexico and Canada from February 1st onwards. Despite gold market analysts highlighting the possibility of safe haven inflows to have supported gold’s price in the inauguration, the actual support gold’s price enjoyed over the inauguration day was little. Hence, such safe have inflows may be possible in the future, may even be probable, yet are still to be seen.
Gold’s negative correlation with the USD
If one compares the movement of the USD Index to gold’s price over the past seven days we may conclude that he negative correlation of the USD with gold’s price is in effect as the USD edged lower against its counterparts while gold’s price edged higher. Yet it seems that gold’s price is unable to enjoy support to the full extent USD’s weakening as gold’s rise remains asymmetric if compared to USD weakening yesterday. Overall though we tend to see the case for gold’s price to be affected by the direction of the USD, something that was not in force in the past weeks. Should we see the USD regaining its confidence and start rising over the coming week, we may see gold’s price weakening and vice versa. Also we note that US bonds have dropped over the past week, which in turn may have allowed for some support for gold’s price to build up, given the negative corelation of US bond yields with gold’s price. Should we see a renewed fall of US bond yields in the coming week, we may see gold’s price getting further support.
The Fed’s stance
As for monetary policy we note that market expectations currently are for the Fed to cut rates again in the June meeting and is almost fully pricing in, according to Fed Fund Futures, that the bank will remain on hold in its next meeting on January 29th. We’ll be having another report until then, yet we would like to note that with Trump now in office and given his intentions to crack down on immigration and impose tariffs on US imports from Canada and Mexico, we may see inflationary pressures in the US economy becoming even more persistent or even flaring up, which may in turn force he bank to adopt a more hawkish stance. Such a stance could support the USD and at the same time weigh on gold’s price.
China’s PBoC continues Gold buying
On a purely “demand and supply” viewing of the gold market, we have to note that PBoC’s gold buying spree which restarted in November, was continued in December and may very well be continued in the coming month. China’s central bank seems to be trying to diversify its reserves by increasing the gold part, preparing for the possibility it needs to defend its currency in the international FX market yet at the same time may wish to further decouple from the USD. Should we see PBoC’s gold buying spree being continued or even intensifying, we may see it having a beneficial effect for gold’s price as the demand side of the gold market may tighten further.
Technical analysis
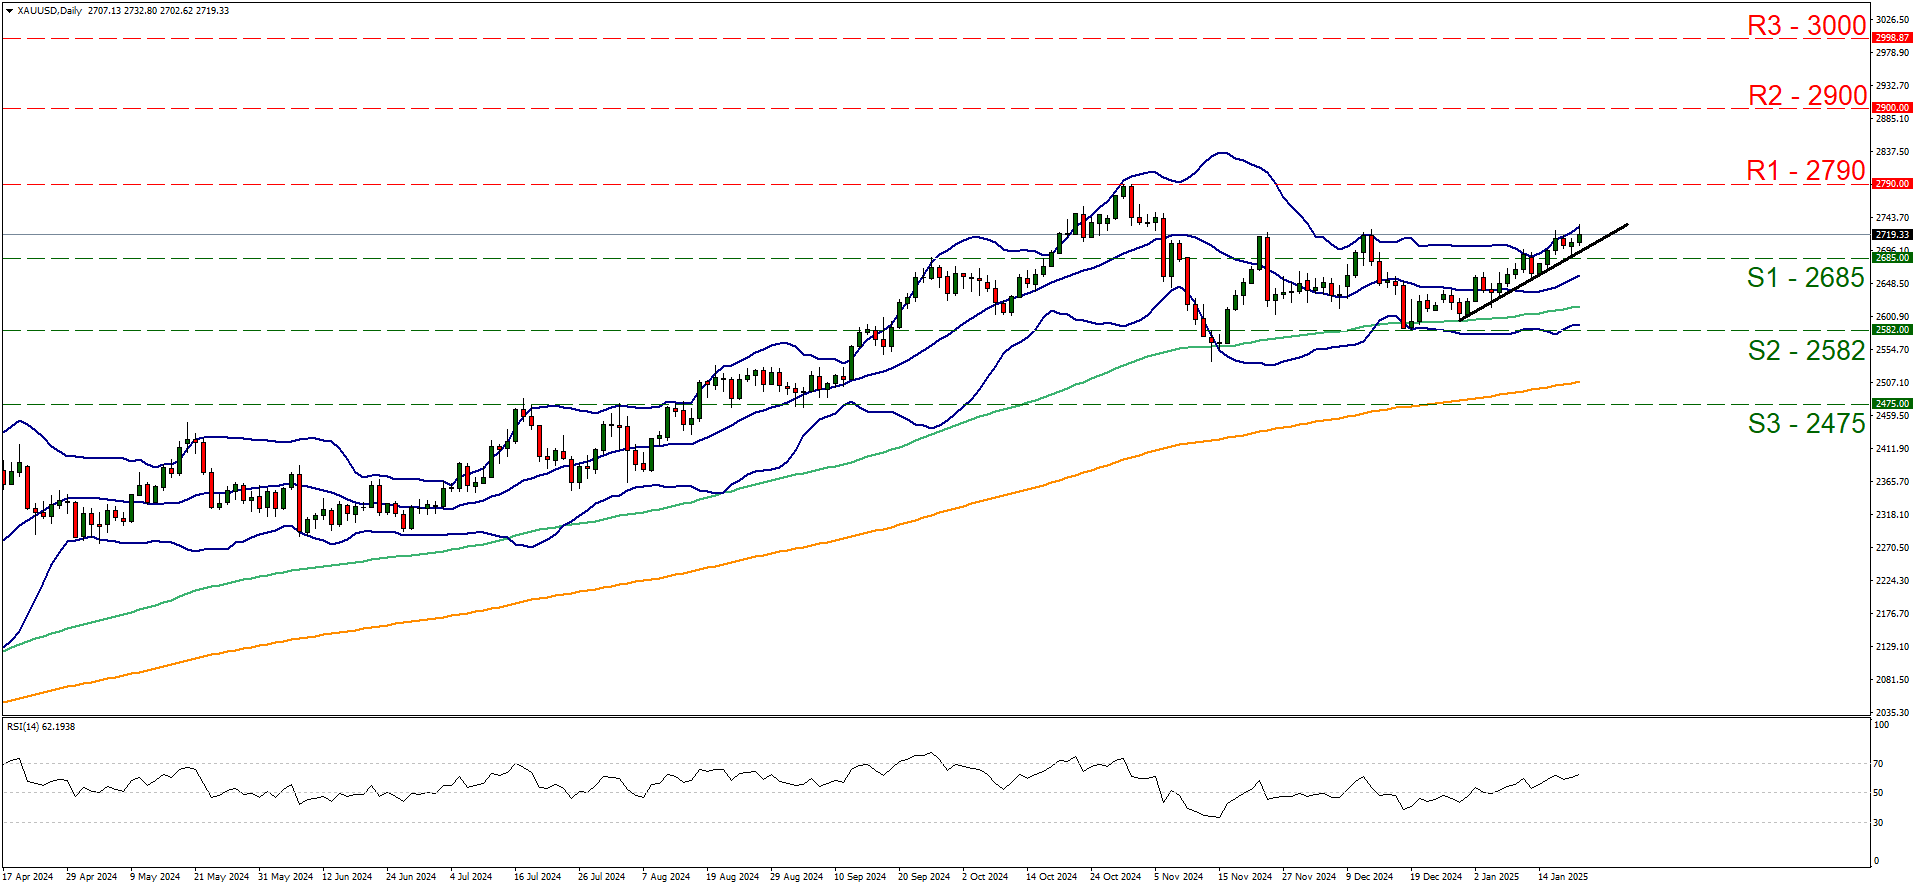
XAU/USD daily chart
Support: 2685 (S1), 2582 (S2), 2475 (S3).
Resistance: 2790 (R1), 2900 (R2), 3000 (R3).
On a technical level, gold’s price continued its journey north of the 2685 (S1) support line during today’s Asian session. We intend to maintain our bullish outlook for the precious metal’s price, as long as the upward trendline guiding gold’s price since the 30th of December. Furthermore, we note that the RSI indicator has risen above the reading of 50 and is currently aiming for 70, implying a strengthening bullish sentiment among market participants for gold’s price. On the other hand gold’s price action is flirting with the upper Bollinger band, which may slow down the bulls somewhat. For the bullish outlook to be maintained, we expect gold’s price to continue to aim for the 2790 (R1) resistance line, a level that marks practically a record high level for gold’s price. As the next possible target for the bull we set the 2900 (R2) resistance level. For a bearish outlook we would require gold’s price to reverse direction, breaking the prementioned upward trendline, in a first signal that the upward movement of gold’s price has been interrupted and continue lower to break the 2685 (S1) support line actively aiming if not breaching the 2582 (S2) support barrier.