
Two weeks ago I took a look at the Oakland Athletics’s recent draft history and somewhat previewed what I think about their draft strategy and how it is evolving with David Forst as general manager. The only main issue with evaluating their recent history is the lack of time for most of these players to develop, giving us an incomplete-at-best look at his success or lack thereof as the face of the Athletics front office. With only eight drafts, one shortened, under his belt even one mistake would provide a glaring hole and cause issues with sample size with regards to any meaningful evaluation. So, I compiled data on the last 20 drafts for Oakland, and I’m going to take a look specifically at how their focus on specific demographics has evolved.
So, for the methodology here, I compiled every pick they have made over the last 20 years that has signed with the organization. I have information on the rate of players developing into major league players (even if their career was brief), the fWAR production of the players, and for top 10 round picks — which we have complete data on — their signing bonuses. Ultimately I decided to divide the players into four categories: First round picks, second through fourth round picks, fifth through tenth rough picks, and any day three picks. My reason for the specific division was just an evolution through the process, as while separating out first round picks is obvious it became apparent that the approach to second through fourth round picks for Oakland is fairly similar and they will spread out money through those rounds but not beyond them. Fifth round and later picks tend to be nearly exclusively low-bonus college signs, whereas those early middle rounds do often contain Oakland’s premium talent. I also excluded junior college players from this evaluation because Oakland has only signed eight in the top ten rounds over the past 20 years and none under Forst, so focusing time on that isn’t really productive given the lack of investment there. First round picks include all players that baseball-reference qualifies as a first round pick (including supplemental picks), and baseball-reference was the source of most of the data although I did utilize Fangraphs for their WAR as it’s just a personal preference in that regard. As not all first round picks are created equally I also thought it specifically important to look at signing bonuses for players, as with the structure of the draft for major league baseball discussing the draft as a whole has greater weight. For my demographic looks I did include all 20 years in regards to financial and selection investment, but I discounted the last four seasons when looking at production from those picks as it’s unfair to expect players from 2020 and on to have made a major league impact yet. It’s also important to recognize that 20 years of one specific organization aren’t enough to make wide-ranging conclusions about draft strategy, and my only intent is to look specifically at where Oakland has had success.
The final key point that I had to debate over was specifically how to treat Sean Doolittle. Doolittle had a solid major league career and is certainly a draft win, but my concern was how to properly quantify him as a first round pick. I don’t believe that converting a hitting prospect into a pitching prospect is a repeatable skill for an organization (although I recognize Doolittle was both as an amateur), thus my ultimate decision was to qualify him as a first round, college hitter but only use his major league position player production (which is zero, and a non-major leaguer). Ultimately his qualification didn’t make much difference to my conclusions, and would have in my opinion unfairly bolstered the numbers for college pitching, but even then his effect on the overall numbers was only around 6% for pitchers.
First rounds picks
Whether during Forst’s time as the general manager or Billy Beane’s, Oakland heavily invested in college talent and specifically college hitting. In total 17 of 30 first round picks in the past 20 seasons, along with 15 out the 25 for the sample I compiled WAR data on were college hitters. The Athletics clearly believe that spending on college position player talent early is an efficient use of their resources, but the numbers for the organization haven’t born that out. In that 25 pick sample not only does college hitting trail other categories in the rate of MLB players produced at 10 out of 15 compared to eight of ten for all others, it is also by far the worst in regard to fWAR production. Now, Oakland has invested less on average per pick with regards to their signing bonuses, but even the production per dollar trails significantly. Another way to look at it is to look at the places Oakland has picked and the average WAR produced by those picks. Oakland’s college hitters have produced just 59.4% of the expected WAR value, while prep hitting sits at producing 62% MORE than the average and college pitching has slightly more than doubled the expected WAR.
A’s 1st Round Production 2004-2019
| 2004-2019 | FWAR/Pick | $/fWAR | $/Pick | Picks |
|---|---|---|---|---|
| 2004-2019 | FWAR/Pick | $/fWAR | $/Pick | Picks |
| College Hitting | 2.26 | $751,891 | $1,699,273 | 15 |
| College Pitching | 8.58 | $215,793 | $1,851,500 | 5 |
| High School Hitting | 7.80 | $315,582 | $2,461,540 | 5 |
When looking at their recent history with college hitting it’s apparent why this discrepancy exists, as they’ve had just one real success with Matt Chapman producing 27.4 FWAR out of the total 33.9 fWAR. In comparison Oakland has invested little in prep hitters, with a third of the total picks and less than half the total signing bonuses, yet still with the likes of Matt Olson and Addison Russell leading the way produced 39 fWAR with Olson seemingly prepared to still add significantly to that total. The point to take from this is that it seems that Oakland has adjusted to this information. Prior to him taking over as general manager Oakland used 63.2% of their first round picks and 62.2% of their first round bonus money on college hitting. Since 2016 that number has dipped dramatically, with Forst giving out 45.5% of first round picks and 48.0% of first round money to college hitters.
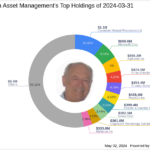
There has been a slight increase in investment into college pitching, which as we can see leads the way in production effeciency but seemingly has never been a focus for Oakland. Only one of their five first round pitchers (AJ Puk) was drafted in the top half of the draft, with two in the top 25. Compare that to two of the eight prep hitters in the top 15 and four of them in the top 25 and it’s clear Oakland prefers to not spend significantly on pitching. The significant increase has shifted towards prep hitting, where the total picks jumped from 21% to 36.4% under Forst, and the money spent has seen a similar increase of 25.1% to 36.6%.
:format(webp):no_upscale()/cdn.vox-cdn.com/uploads/chorus_asset/file/25315998/Rate_of_pick_usage_by_demographic.png)
This increase in usage is vital to the health of the system. Generally the rate of expenditure on first round hitting talent has stayed level between the two eras of drafting. Prior to 2016 the Athletics spent 63.8% of the total money spent on hitters with their first round picks, and that number has only slightly decreased to 60.4% since 2016. A majority of the investment Oakland makes in position player talent comes from their first round picks, and it seems the main decision was which demographic to divvy that money to.
Early-to-mid round picks
Given the drop off in investment in college hitting early in the draft you may expect that under Forst the total investment in college hitting has also dropped significantly. This is actually far from the case. Forst has overall increased both the rate of college hitters taken and the money invested, and most of that increase comes from this range of the draft. Now, overall the investment in high school pitching has been minimal throughout Oakland’s history, which isn’t surprising given the organization’s risk-aversion. Developing pitchers for four or more years is a tough road and Oakland has widely chosen to pick their spots and done a good job in these rounds. However when looking at bulk production, Oakland has managed to get more out of these early-to-mid round college hitters than they did from their first round picks.
A’s 2nd-4th round pick production
| 2004-2019 | FWAR/Pick | $/fWAR | $/Pick | Picks |
|---|---|---|---|---|
| 2004-2019 | FWAR/Pick | $/fWAR | $/Pick | Picks |
| College Hitting | 1.46 | $485,057 | $706,028 | 18 |
| College Pitching | 0.50 | $1,033,888 | $516,944 | 17 |
| High School Hitting | 0.83 | $1,006,818 | $830,625 | 8 |
| High School Pitching | 1.81 | $353,593 | $640,888 | 8 |
Due to the horrid nature of their first round production Oakland-drafted college hitters have produced far worse than the other three demographics, but when excluding those early failures they steam to the top both in WAR per pick and money spent per fWAR. It’s not even particularly close, as from the second round on they are the only demographic to produce 1 fWAR per pick, and the $366,701 per fWAR produced far exceeds the second best mark of $517,372 per fWAR from prep pitching. The adustment made by Forst in this regard has been staggering, with pick investment in college hitters for these rounds jumping from 29% to 50% and financial investment jumping from 29% to 45%. Every other demographic has dipped in this range accordingly, although especially given the recent money thrown at Steven Echavarria the money given to prep pitchers in this range has dipped only slightly from 20.7% to 18.2%. This is the only range they have struggled to produce success among college pitchers, generating just 0.5 fWAR per pick and spending a class-leading $1,033,888 per fWAR.
All Other Picks
Demographic shifts in late day two and day three picks have largely not changed, and that’s due mostly to baseball as a whole primarily drafting college talent in these rounds. Most high school talent that dips to this point will end up going to college, and it shows with Oakland only producing 0.1 fWAR from their prep players from round five to ten. Oakland would occasionallt drop a chunk of money on a prep player prior to 2016, with 22.9% of their bonus utilization prior to 2016 going to prep pitchers, but those numbers have dwindled since 2016 with prep pitchers in this range accounting for just 4.8% of Forst’s bonuses. The numbers say that Oakland’s hitting talent in this range has produced their most efficient value, with 0.72 fWAR per pick and only $199,984 per fWAR, but that is almost exclusively value produced by Max Muncy 1.0 who did not even produce that in the A’s organization. On the pitching side however they have managed to run into a couple of successes, notably Blake Treinen, and this is the range where Oakland is intent on utilizing their money to find college pitching. Roughly half of these picks are college pitchers, and under Forst the financial investment in college pitching from rounds 5-10 has jumped from 39.8% to 49.1%. This part will have to diverge from pure quantitative assessment, as pitchers left in this range tend to have a better chance of making it to the major leagues purely because of the amount of jobs available to pitching. Forst has used only nine of his 37 picks in the top four rounds on pitching, and he has to fill out minor league rosters somewhere. Oakland has managed to turn a handful of these guys into major league relief arms, a success in a range where they are only investing around $140k per pick.
Some teams will invest in prep talent beyond round ten, where there is a built-in $150k to work with given the draft rules, but Oakland is not one of those. Forst made a notable overslot selection of T.J. Schofield-Sam in 2019, but otherwise has mostly kept below or only slightly gone over the 150k (previously 125k) limit. This is just not the range of the draft to produce significant major league talent, though Oakland has had a few small finds on the pitching staff. Mostly due to Dallas Braden in 2004 Oakland has produced 17.7 fWAR from their day three college pitching picks, and that’s a notable amount given that the second-highest production is college hitting at 1.2 fWAR. 8.1% of college players drafted by Oakland in this range went on to have major league careers, versus one out of the 20 prep players drafted (for a total of 0.1 fWAR).
In total the investment in the top ten rounds from hitters has increased under Forst, as they have jumped from spending 65.96% of their signing bonuses on hitters to 71.50%. The production per pick overall in the top ten rounds also favors hitters, with them getting 2.27 fWAR from prep hitters and 1.33 fWAR from college hitters, though college pitching has been more efficient on a per-dollar basis. The shift away from college hitting in the first round has really been the key takeaway here, though we’re still dealing with a small sample that could completely flip by the end of 2025. Still, given where Oakland invests their resources in trades they need to come away with high-ceiling position player talent somewhere, and it seems they have chosen to invest more heavily in prep hitters in order to fill that void. Under Forst the total investment in prep hitters has jumped from 22.04% of the signing bonuses to 26.37%, though there has been a shift away in the second through fourth rounds. College hitting has largely been given the same investment across general managers, with a redistribution of that money towards the middle rounds and away from the first round where Oakland has largely failed to produce talent from college hitting. It will be years before we truly know how these decisions will affect the future of the organizations, and whether Forst will stick to these trends, but given the recent developmental history of the team their surface demographic trends seem to be positive.


