
To create the most value for shareholders, companies must define more ambitious and ambidextrous strategies to achieve the right balance between cost control and growing revenues. A large number of investors already consider Starbucks (NASDAQ: NASDAQ:SBUX) to be one of the best businesses on the planet, both in growing its overall sales and in improving margins through operational efficiency and rising same-store sales. Same-store sales are one of the important drivers in the restaurant industry. Same-store sales directly drive the revenues. It measures the percentage change in the revenues generated by existing restaurant locations over the same period last year.
Starbucks Key Value Drivers – Revenue growth, Operating margin, Same-store sales and Economic profit
The scope of this article will be to look at the key value drivers of Starbucks. Starbucks achieved double-digit revenue growth for the third straight year in 2014, which is nearly 2 times the performance of the broader market as measured by the S&P 500. Operating margin also reached a new record as the growth in operating profits drove the margin to over 23%. Starbucks achieved 20 consecutive quarters of same-store sales of 5% or greater. And in the U.S., which is the company’s largest business, it averaged 7% of same-store sales over that same period, which is again nearly double that of its peer group.
Based on my valuation model and assumptions, I am calculating the impact of these three key value drivers (sales growth, operating margin and same-store sales) on Intrinsic Valuation through base, bull and bear case scenarios.

Let us now consider the details of my financial forecast for Starbucks:
Base case scenario
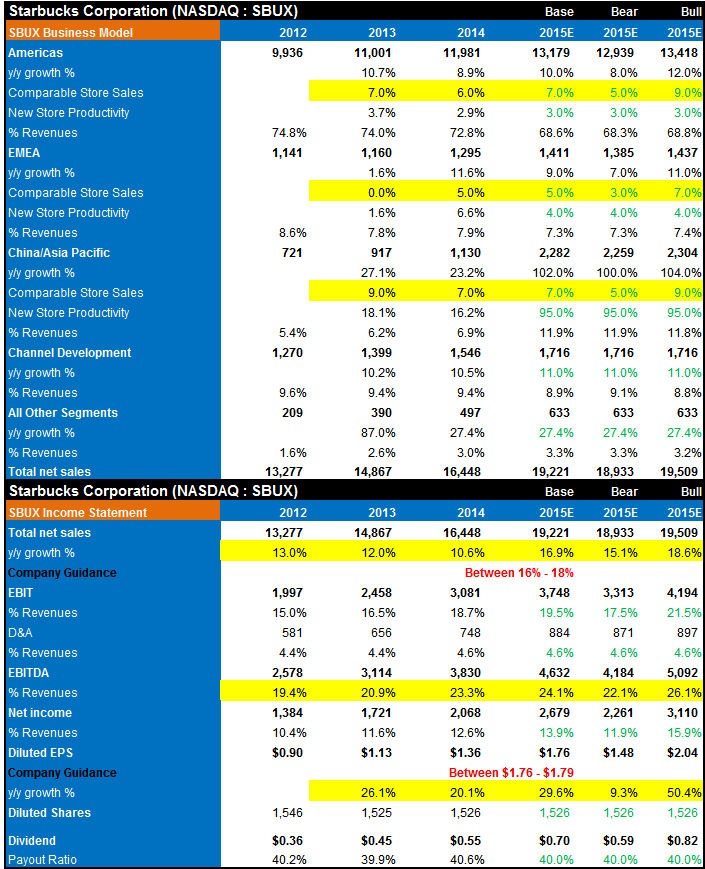
My base case scenario assumption for revenue and EPS is based on Starbucks’ guidance for FY2015. I assumed revenue growth within the range of 16% to 18% and EPS within the range of $1.76 to $1.79.
My model reflects a projected average EBITDA margin of 24%, which is above Starbucks’ trailing 3-year average.
Same-store sales is the major driver of Starbucks’ revenue growth. I assumed same-store sales at slightly higher than 2014 for Americas segment. The Americas segment is the most mature business and has achieved significant scale (accounting for 73% of fiscal 2014 revenues). Therefore, investors will be watching the same-store sales metric very closely for the Americas segment. In FY2015, if same-store sales in the Americas segment come higher, investors should see the stock rise. If same-store sales grow in other regions, the stock should do even better. But if it fails to meet expectations, investors may rush out.
With these inputs, my Intrinsic Value calculation for Starbucks comes out between $55 to $58 which, at the time of writing, suggests that shares are fairly valued.
Bull & Bear case scenarios
In calculating the impact of the three key value drivers on Intrinsic Valuation, I changed only the variable under review (same-store sales and operating margin) in the bull & bear case scenarios. All other assumptions remain unchanged.
In the bull case scenario, I tweaked same-store sales up by 2% and operating margin by 200 basis points. With these inputs, my Intrinsic Value calculation for Starbucks comes out between $63 to $65 which suggests that shares are undervalued.
In the bear case scenario, I tweaked same-store sales down by 2% and operating margin by 200 basis points. With these inputs, my Intrinsic Value calculation for Starbucks comes out between $47 to $52 which suggests that shares are overvalued.
Here, all I want to say is that Starbucks’ intrinsic value changes between $47 to $65 due to changes in value drivers. By monitoring these value drivers, investors can get a fair idea of long-term trends.
Economic Profit Analysis (ROIC – WACC Spread)
Starbucks has been generating economic value for shareholders for the past few years, a track record I view very positively. The best measure of a firm’s ability to create value for shareholders is expressed by comparing its return on invested capital with its weighted average cost of capital. The gap or difference between ROIC and WACC is called the firm’s economic profit spread. Starbucks’ 3-year historical return on invested capital is 20%, which is above the estimate of its cost of capital of 10%.

Conclusion
So, summing up, I can conclude that Starbucks’ stock could go higher if it beats key value drivers expectations:
- Consistent increases in same-store sales
- Consistent revenue growth
- Consistent margin, growth cannot create value unless it is profitable
- Economic value for shareholders (ROIC – WACC Spread)
- And of course, last but not least – Starbucks pays a dividend that continues to grow
But if it fails to meet expectations, investors may see a selloff. You’ll have to wait and see what happens following Starbucks’ next earnings release.


