

Hiroshi Watanabe
By Evan Bauman & Aram Green
Consistently Targeting Mid Cap Plus Growth Opportunities – Market Overview
The positive momentum of 2023 extended into the first quarter as increased likelihood of an economic soft landing combined with a relatively favorable monetary backdrop sent stocks broadly higher. The S&P 500 Index (SP500, SPX) advanced 10.56% for its best start since 2019, boosted by solid corporate earnings and continued enthusiasm for generative artificial intelligence (AI). After the market showed signs of broadening in the fourth quarter, mega cap growth stocks flexed their leadership yet again to start the year, with the Russell Top 200 Growth Index (11.70%) being the best-performing segment for the quarter.
Boosted by strong performance from several of the Magnificent Seven, growth stocks maintained their advantage over value stocks in a historically concentrated market with the Russell 3000 Growth Index rising 11.23% and outperforming the Russell 3000 Value Index by 261 basis points. Smaller capitalization growth stocks also rose strongly but failed to keep up with the top-heavy, market-wide indexes, as the Russell Midcap Growth Index and the small cap Russell 2000 Growth Index advanced 9.50% and 7.58%, respectively.
As market concentration has grown to extreme levels, indexes such as the Russell 3000 Growth have morphed from a diverse, all cap universe to become increasingly concentrated in a handful of mega cap stocks residing in a few industries. This shift has increased the average market cap of many portfolios, while also reducing their diversification and active share. Meanwhile, the ClearBridge Aggressive Growth Strategy has stayed steadfast in our investment approach and continues to target emerging franchises early in their growth lifecycle. This has caused our long-time benchmark, the Russell 3000 Growth Index, to become a mega-cap-dominated and less relevant measure of our stock selection and risk management efforts.
Exhibit 1: Russell 3000 Growth Concentration in Top 10 at Historic Highs
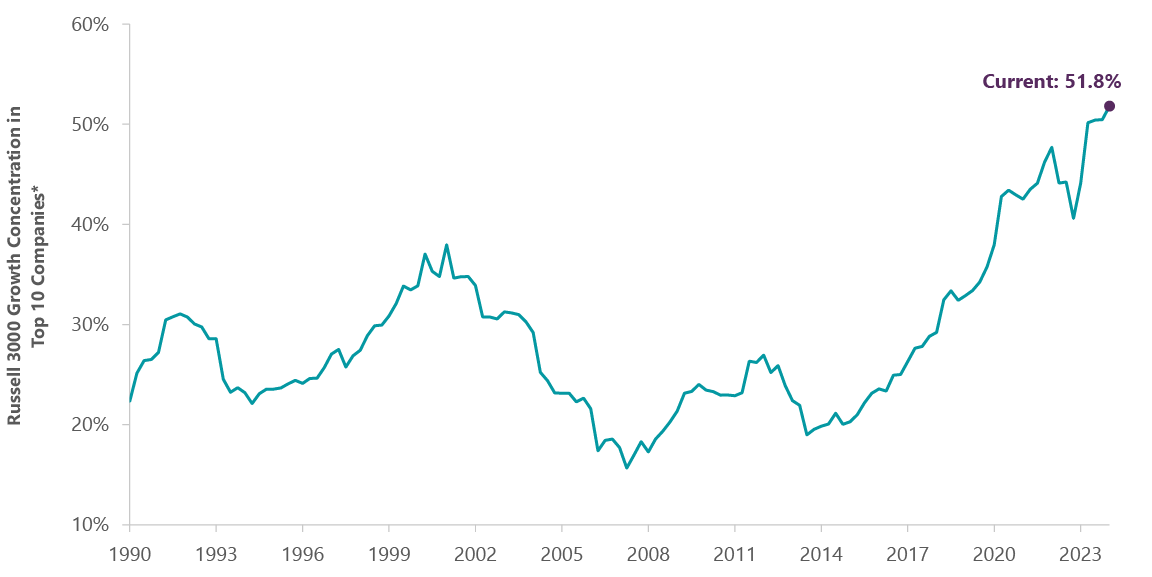
As of March 31, 2024. Source: FactSet. *Top 10 companies includes calculation of both Alphabet A & C share classes as one entity.
Additionally, this combination of mega cap concentration and capitalization limits for small and mid cap indexes has caused a wide gap to emerge between large cap and traditional mid cap growth asset classes. Such disparity has led to a cohort of high-quality growth companies from the upper end of mid cap to the lower end of large cap being less well represented in investor allocations. Characterized by stocks in the roughly $10 billion to $100 billion capitalization range today,1 we believe this “mid cap plus” segment is ripe for investment and merits inclusion in portfolios.
Based on a cross-sectional analysis of the Russell 3000 Growth Index2, we found that over the last 20+ years names in this mid cap plus segment have had superior median returns than both larger cap and smaller cap companies. However, while returns were superior on average, not all stocks in this group were created equal. In fact, as you move down the market cap spectrum, away from mega and larger cap companies, dispersion steadily increases. We believe this creates a compelling opportunity for active managers.
During the first quarter, a number of portfolio companies in this mid cap plus range were leading contributors to performance, including CrowdStrike (CRWD), Airbnb (ABNB), HubSpot (HUBS) and Autodesk (ADSK).
However, these results were offset by weakness among certain health care holdings, most notably Biogen (BIIB), UnitedHealth (UNH), Ionis Pharmaceuticals (IONS) and Insulet (PODD). Consumption-driven technology names Snowflake and MongoDB were also detractors as client IT budgets remain constrained.
Portfolio Positioning
The return to a narrow, momentum-driven market in the first quarter enabled us to harvest more profits from larger cap holdings UnitedHealth and Broadcom and put the proceeds to work across new ideas. This is an approach we have been consistently implementing over the last several years, methodically bringing down the average market cap of the portfolio while continuing to improve its growth profile.
Diversifying our industry and sector exposures has also been a focus of our repositioning efforts, furthered in the quarter with profit taking in Vertex Pharmaceuticals (VRTX) and the initiation of three new companies in the industrials and consumer sectors. Additionally, we increased our exposure to W.W. Grainger (GWW), purchased in late 2023.
Old Dominion Freight Line (ODFL), in the industrials sector, was our largest new buy. The company is the second-largest less-than-truckload (LTL) provider in North America with a national footprint. Transportation has experienced a longer than usual freight recession that could create a constructive macro setup going forward. The potential for nearshoring/reshoring of industrial manufacturing and localization of retail distribution are also potential longer-term tailwinds for this industry. We believe Old Dominion is well-positioned for continued share gains in a large, consolidated LTL market and capable of generating durable revenue growth on the back of volume and pricing increases. The company owns the real estate for over 95% of its service centers, whereas competitors typically lease about half of theirs, which we view as a significant competitive advantage for Old Dominion to expand capacity and market share.
In consumer sectors, we added Tractor Supply Company and e.l.f. Beauty (ELF). Tractor Supply (TSCO), in the consumer discretionary sector, is the largest rural lifestyle retailer in the U.S. We believe the company has meaningful scale and distribution advantages giving it a cost-to-serve edge, and notably generates 77% of sales from its 32 million loyalty members. Despite being the biggest retailer of its kind, Tractor Supply has only high single-digit market share of its large and growing addressable market, estimated to be approximately $180 billion. We see opportunities for Tractor Supply to resume its strong earnings trajectory as growth related to post-pandemic normalization nears a bottom. Operating margins have been flat for the past few years, but with investments peaking, margins should start to lever again with same store sales growth.
ELF, in the consumer staples sector, is the third-largest mass cosmetics brand in the U.S. We believe the flywheel of ELF’s consumer value proposition, its innovation pipeline, and its unique ability to bring prestige-like products to mass consumers and high consumer engagement will enable the company to continue to outgrow the global market. We see significant opportunity for ELF to transform itself from an emerging U.S. color cosmetics brand to a global beauty stalwart by doubling its share in the U.S. over the next few years and gaining share in international and skincare markets. ELF is profitable, balancing growth and earnings, and has an attractive balance sheet.
Within communication services, we continued to eliminate smaller media positions, de-emphasizing subscale programmers. Actions during the quarter included the sale of Warner Bros. Discovery (WBD) and Match (MTCH). We have higher conviction in TKO (TKO) and Liberty Formula One, which are highly contracted, cash-generative businesses linked to the long-term growth of sports and live events. TKO, formed in the third quarter of 2023 from the merger of UFC and WWE, signed a significant new 10-year rights deal with Netflix during the quarter and also settled an antitrust lawsuit with MMA fighters. Consistent with our commitment to harvest more mature growth companies to fund the purchase of new ideas, we also exited a minimal holding in Meta Platforms.
Outlook
Despite the growing chorus for a soft landing, equities still face an uncertain macro backdrop. Budgetary constraints are impacting earnings visibility across health care companies and enterprise software customers to name just a few. In this environment, we want to own high-quality, market share gainers, run by seasoned management teams, that have the ability to generate significant free cash flow. We continue to look for new ideas consistent with this philosophy.
These fundamentals have been guiding our portfolio construction and risk management activity for the past several years. The result is a more balanced portfolio that emphasizes quality growth companies across a wider range of sectors and in a market cap range that has historically outperformed both the largest stocks in the market as well as smaller cap companies.
We believe the attractive qualities of the mid cap plus segment have been crowded out by the story stocks of the Magnificent Seven. As these mega caps have grown in size and prominence in widely tracked growth indexes, the case for owning mid cap plus companies has only grown, creating a compelling opportunity for us as active managers to exploit.
Portfolio Highlights
The ClearBridge Aggressive Growth Strategy underperformed its benchmark in the first quarter. On an absolute basis, the Strategy delivered gains across seven of the eight sectors in which it was invested (out of 11 total). The primary contributor was the IT sector while the health care sector was the sole detractor.
Relative to the benchmark, overall stock selection detracted from performance. In particular, stock selection in the health care, IT and communication services sectors had the biggest negative impacts on results. On the positive side, an underweight to the consumer discretionary sector contributed to performance.
On an individual stock basis, the leading absolute contributors were positions in CrowdStrike, Broadcom (AVGO), Airbnb, Autodesk and HubSpot. The primary detractors were Wolfspeed (WOLF), Biogen, Snowflake, UnitedHealth and Ionis Pharmaceuticals.
Evan Bauman, Managing Director, Portfolio Manager
Aram Green, Managing Director, Portfolio Manager
|
1 We think about this “mid cap plus” universe in terms of market cap percentiles of the Russell 3000 Growth Index, not a fixed range. Mid Cap Plus ranges from the 80th percentile to the 97th percentile, corresponding to a range of $10 billion to $127 billion. 2 We divided the Russell 3000 Growth Index into 50 buckets based on monthly market cap back to 1985 with roughly an equal number of names in each segment. For each of these groupings of around 30 names, we calculated the cross-sectional mean return as a measure of expected return from investing in each bucket. Past performance is no guarantee of future results. Copyright © 2024 ClearBridge Investments. All opinions and data included in this commentary are as of the publication date and are subject to change. The opinions and views expressed herein are of the author and may differ from other portfolio managers or the firm as a whole, and are not intended to be a forecast of future events, a guarantee of future results or investment advice. This information should not be used as the sole basis to make any investment decision. The statistics have been obtained from sources believed to be reliable, but the accuracy and completeness of this information cannot be guaranteed. Neither ClearBridge Investments, LLC nor its information providers are responsible for any damages or losses arising from any use of this information. Performance source: Internal. Benchmark source: Russell Investments. Frank Russell Company (“Russell”) is the source and owner of the trademarks, service marks and copyrights related to the Russell Indexes. Russell® is a trademark of Frank Russell Company. Neither Russell nor its licensors accept any liability for any errors or omissions in the Russell Indexes and/or Russell ratings or underlying data and no party may rely on any Russell Indexes and/or Russell ratings and/or underlying data contained in this communication. No further distribution of Russell Data is permitted without Russell’s express written consent. Russell does not promote, sponsor or endorse the content of this communication. Performance source: Internal. Benchmark source: Standard & Poor’s. |
Editor’s Note: The summary bullets for this article were chosen by Seeking Alpha editors.


