

Torsten Asmus/iStock via Getty Images
First Quarter Market Discussion
The narrative in the market has gone from talk of a ‘hard landing’ (deep recession) to a ‘soft landing’ (mild recession) and now possibly ‘no landing’ (no recession) at all. Add to that investors’ hope the economy could get a boost from lower Federal Reserve policy rates, federal infrastructure spending, and/or productivity increases driven by AI technology, and it’s no surprise that risk aversion seemed to evaporate in the first quarter.
Relief that a recession might be avoided and excitement for potential economic re-acceleration pushed the S&P 500 Index up 10.56% in the first three months of the year, while the Russell Midcap® Index rose 8.6%.
Of course, this excitement overlooks the considerable costs and time that will be required to achieve speculated future AI-related productivity benefits. It also belies cracks in the foundation of the economy that shouldn’t be ignored. In the aftermath of the global pandemic, for example, households have drained down their excess savings, with personal savings as a percentage of disposable income now at historically low levels (see chart below).
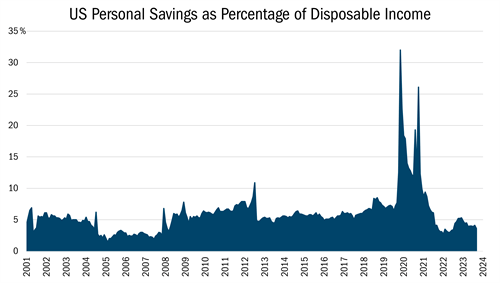
| Source: Bloomberg, Monthly Data from 6/1/2001 to 2/29/2024. This chart represents US Personal Savings as Percentage of Disposable Income. All indices are unmanaged. It is not possible to invest directly in an index. Past performance does not guarantee future results. |
Consumers aren’t just saving less, they are borrowing more too. Auto loans, borrowing against 401(k)s, and credit card balances are all on the rise, as are delinquencies on repaying that debt. Consumers should not be the only concern. More than $2 trillion of commercial real estate debt is set to mature between now and the end of 2028, suggesting the potential for rising defaults in that space yet distressed commercial property sales remain muted.
We are not entirely convinced of the ‘no landing’ narrative that is dominating the markets. However, we also understand it is one possible outcome on a spectrum of many scenarios. We cannot allow these macro questions to drive our decision making because the answers are unknowable, and the equity market is a discounting mechanism. As such, our job is to allocate capital towards the most attractive opportunities in the midcap value universe while managing risk through sound portfolio construction.
Attribution Analysis
The Mid Cap Value (MUTF:HRMDX) (MUTF:HNMDX) portfolio gained approximately 5.7% in the first quarter, lagging the Russell Midcap® Value Index, which was up 8.2%. Most of the underperformance was driven by a low hit rate on our stock selection in Financials and Industrials, where our Strategy trailed benchmark constituents.
Our underperformance was driven by the securities we hold and by the ‘opportunity cost’ of not owning certain other stocks within the midcap universe. The latter headwind was particularly noticeable in Financials, where securities that appear misplaced in the Russell Midcap® Value Index including Coinbase Global, Inc. (COIN), Robinhood Markets, Inc. (HOOD), Block, Inc. (SQ), and SoFi Technologies Inc. (SOFI) make up more than 6% of the sector.
In the first quarter, cryptocurrency-related stocks Coinbase and Robinhood saw their shares surge more than 50% as the price of digital tokens jumped. Our commitment to attractively priced, well-run companies with strong fundamentals—guided by our 10 Principles of Value Investing™—prevents us from owning these businesses, and we are quite comfortable with this positioning. We believe that our efforts are better spent identifying undervalued shares of financially strong businesses, even if it takes time for the markets to see their true value.
Regarding businesses we owned that were detrimental to performance, First American Financial Corporation (FAF) in the Financials sector and J.B. Hunt Transportation Services, Inc. (JBHT) in the Industrial sector were detractors to overall performance. Both are industry-leading cyclical businesses currently working through the weak point in their business cycles, including title insurance in the case of FAF and freight transportation in the case of JBHT. Our thesis for owning both remains unchanged.
Portfolio Activity
We construct our portfolio for the long term with a balanced and bottom-up approach. Overlaying our 10 Principles of Value Investing™, we implement a two-bucket strategy by seeking to own both high-quality companies trading at decent bargains (“quality value”) and deeply discounted companies that have produced poor economic returns over time (“deep value”). We do this because these two styles within value investing tend to alternate market leadership, just as growth and value strategies generally take turns outperforming.
Today’s economic backdrop offers a good illustration of how the two-bucket approach can be useful. While we are skeptical that investors’ expectations of a ‘no landing’ scenario will unfold precisely as expected, we also can’t say for certain that conventional wisdom is wrong. If the market continues in a ‘risk on’ mode, deep value securities could have an outsized benefit. On the other hand, if the economy is weaker than current market expectations, capital is likely to favor quality value characteristics including high returns on capital, robust free cash flow, and pricing power. That said, we question whether the market will pay any price for those attributes, which often seemed to be the case in the pre-2022 interest rate environment.
The following are two examples of new holdings in the quality value category and one example of a detractor in the deep value bucket:
Industrials
Donaldson Company Inc. (DCI), a filtration manufacturer with more than a century of experience in air, lubricant, hydraulic, and fuel filtration applications, is a new position this quarter.
DCI, an example of a stock in our quality value bucket, typically trades at a premium to its peers, an indication of the market’s appreciation for its economically resilient revenues and high profit margins. However, the company has faced margin headwinds lately, in part owing to heavy upfront investment in its fast-growing life sciences segment. Moreover, several of DCI’s cyclical end markets, including agricultural, mining, and construction equipment, have been under pressure as lower equipment utilization has translated into fewer filter replacements.
We think investors have already incorporated the life sciences operating losses in the company’s valuation, but we believe the segment will ultimately be accretive to revenue growth and margins. If life sciences operating margin approaches the corporate average of around 15% over the next two years, that could translate to a 10-15% lift in total earnings power. For context, this segment’s operating margin exceeded 20% prior to the current investment phase.
Investors don’t typically gravitate to industrials when the ISM Manufacturing Purchasing Managers Index is declining, as was the case from late 2021 through late 2023. Donaldson, however, has historically outperformed in scenarios when industrial activity weakens owing to a revenue base that is mostly consumable. This makes Donaldson a good example of a stock that could perform well on a relative basis if the economy slips into a recession while providing significant upside potential if the economy continues to grow.
DCI is trading at parity today, implying that the market is already pricing in further earnings pressure while we expect the life sciences operational improvement to help buffer potential profit risk in the company’s cyclical end markets.
Consumer Staples
Another new position is The Hershey Company (HSY), the leading chocolate confectionary company in North America with a growing presence in salty snacks and non-chocolate confections.
The maker of such popular brands as Hershey’s, Reese’s, Cadbury, and Jolly Rancher has historically traded at a premium to its consumer staples peers. But in an environment where consumer finances are stressed and input costs are climbing, that premium has disappeared. The stock is down 35% from its 2023 peak due to volume headwinds and margin pressures brought about by rising prices.
We believe Hershey simply needs to demonstrate to investors that these headwinds are cyclical and temporary in nature, while once again showcasing its ability to balance superior profitability with modest growth and stable market share. Cocoa prices, a key input for HSY, have seen a nearly unprecedented price spike on supply disruptions in West Africa (where the majority of global supply originates). While we cannot predict when cocoa prices deflate, we are confident HSY and its largest competitors will be slow to reverse price increases required to recoup the input cost squeeze. Encouragingly, after being hampered by supply chain constraints in the post-COVID-19 environment, HSY has a greater innovation slate and more capacity in place to grow in the coming years. The stock, meanwhile, now trades near historic lows relative to other blue chip consumer staples, the consumer staples sector as a whole, and the broad market.
Healthcare
Perrigo Company PLC (PRGO) is an existing deep value holding that has slumped lately, but we’re encouraged by the self-help progress.
Shares of the consumer health company, with private-label brands spanning allergy and pain relief to digestive health products, fell in response to news that the cost to remediate its infant formula plants will run higher than expected. Last September, the Food and Drug Administration updated industry guidelines for the agency’s approach to inspections and compliance for infant formula production. This included more frequent cleaning of manufacturing facilities, resulting in a slowdown in production.
While the stock reacted to the disappointing infant formula update (which impacts 12% of company sales), we took away notable positives from PRGO’s earnings update including clear signs of progress on market share, margins, and free cash flow generation. More recently, shares have recovered after the CEO appeared at an industry conference and reported faster-than-expected progress made on infant formula remediation. Ongoing progress on the issue should help refocus investors on the positive developments underway.
Part of PRGO’s self-help strategy includes making its U.S. operation look more like its business in the United Kingdom, where higher priced versions of the same molecule are manufactured/sold through PRGO’s existing footprint (analogous to a “good/better/best” product offering often deployed by retailers). In a very asset-efficient manner, these newer products can be sold at 2 to 2.5 times the gross margin of a store-branded drug.
Perrigo is also in the process of eliminating unproductive product lines, as more than 1,500 stock keeping units drive just 1% of operating profit. The stock is enjoying considerable insider buying and is attractively priced at just 12 times earnings.
Outlook
In the long run, our stock-picking success hinges on avoiding short-term speculation and staying true to 10 Principles of Value Investing™, which demands that we stick with well-run companies possessing strong balance sheets that are also trading at attractive valuations. We remain focused on what we can control, including 1) investing in quality value businesses that we think are trading at an appropriate discount to their intrinsic value while avoiding those that lack valuation support; 2) holding an equal-to-overweight position in the quality value category while maintaining adequate representation in the deep value bucket; and 3) purchasing deep value businesses only after identifying a self-help catalyst that we believe can unlock value with execution. Over periods measured in years not quarters, this strategy has served us well.
Fund Returns (3/31/2024)
| Since Inception (%) | 20-Year (%) | 15-Year (%) | 10-Year (%) | 5-Year (%) | 3-Year (%) | 1-Year (%) | YTD* (%) | QTD* (%) | |
|---|---|---|---|---|---|---|---|---|---|
| Mid Cap Value
Investor Class |
9.72 | – | – | – | 11.99 | 8.73 | 16.22 | 5.66 | 5.66 |
| Mid Cap Value
Institutional Class |
10.00 | – | – | – | 12.25 | 9.01 | 16.55 | 5.70 | 5.70 |
| Russell Midcap® Value | 8.41 | – | – | – | 9.94 | 6.80 | 20.40 | 8.23 | 8.23 |
|
*Not annualized Source: FactSet Research Systems Inc., Russell®, and Heartland Advisors, Inc. The inception date for the Mid Cap Value Fund is 10/31/2014 for the investor and institutional class. |
|
©2024 Heartland Advisors In the prospectus dated 5/1/2023, the Net Fund Operating Expenses for the investor and institutional classes of the Mid Cap Value Fund are 1.10% and 0.85%, respectively. The Advisor has contractually agreed to waive its management fees and/or reimburse expenses of the Fund to ensure that Net Fund Operating Expenses for the Fund do not exceed 1.10% of the Fund’s average net assets for the investor class shares and 0.85% for the institutional class shares, through at least 4/5/2025, and subject thereafter to annual reapproval of the agreement by the Board of Directors. Without such waiver and/or reimbursements, the Gross Fund Operating Expenses would be 1.16% for the investor class shares and 1.04% for the institutional class shares. Past performance does not guarantee future results. Performance represents past performance; current returns may be lower or higher. Performance for institutional class shares prior to their initial offering is based on the performance of investor class shares. The investment return and principal value will fluctuate so that an investor’s shares, when redeemed, may be worth more or less than the original cost. All returns reflect reinvested dividends and capital gains distributions, but do not reflect the deduction of taxes that an investor would pay on distributions or redemptions. Subject to certain exceptions, shares of a Fund redeemed or exchanged within 10 days of purchase are subject to a 2% redemption fee. Performance does not reflect this fee, which if deducted would reduce an individual’s return. To obtain performance through the most recent month end, call 800-432-7856 or visit Value Investing Manager Value Mutual Funds | Heartland Advisors. An investor should consider the Funds’ investment objectives, risks, and charges and expenses carefully before investing or sending money. This and other important information may be found in the Funds’ prospectus. To obtain a prospectus, please call 800-432-7856 or visit Value Investing Manager Value Mutual Funds | Heartland Advisors. Please read the prospectus carefully before investing. As of 9/30/2023, First American Financial (FAF), NOV Inc. (NOV), Spectrum Brands Holdings (SPB), represented 2.51%, 4.86%, and 1.59% of the Mid Cap Value Fund’s net assets, respectively. Statements regarding securities are not recommendations to buy or sell. Portfolio holdings are subject to change. Current and future portfolio holdings are subject to risk. The Mid Cap Value Fund invests in a smaller number of stocks (generally 40 to 60) than the average mutual fund. The performance of these holdings generally will increase the volatility of the Fund’s returns. The Fund also invests in mid–sized companies on a value basis. Mid-sized securities generally are more volatile and less liquid than those of larger companies. Value investments are subject to the risk that their intrinsic value may not be recognized by the broad market. The Mid Cap Value Fund seeks long-term capital appreciation and modest current income. The above individuals are registered representatives of ALPS Distributors, Inc. The Heartland Funds are distributed by ALPS Distributors, Inc. The statements and opinions expressed in this article are those of the presenter(s). Any discussion of investments and investment strategies represents the presenters’ views as of the date created and are subject to change without notice. The opinions expressed are for general information only and are not intended to provide specific advice or recommendations for any individual. The specific securities discussed, which are intended to illustrate the advisor’s investment style, do not represent all of the securities purchased, sold, or recommended by the advisor for client accounts, and the reader should not assume that an investment in these securities was or would be profitable in the future. Certain security valuations and forward estimates are based on Heartland Advisors’ calculations. Any forecasts may not prove to be true. Economic predictions are based on estimates and are subject to change. There is no guarantee that a particular investment strategy will be successful. Sector and Industry classifications are sourced from GICS®.The Global Industry Classification Standard (GICS®) is the exclusive intellectual property of MSCI Inc. (MSCI) and S&P Global Market Intelligence (“S&P”). Neither MSCI, S&P, their affiliates, nor any of their third party providers (“GICS Parties”) makes any representations or warranties, express or implied, with respect to GICS or the results to be obtained by the use thereof, and expressly disclaim all warranties, including warranties of accuracy, completeness, merchantability and fitness for a particular purpose. The GICS Parties shall not have any liability for any direct, indirect, special, punitive, consequential or any other damages (including lost profits) even if notified of such damages. Heartland Advisors defines market cap ranges by the following indices: micro-cap by the Russell Microcap®, small-cap by the Russell 2000®, mid-cap by the Russell Midcap®, large-cap by the Russell Top 200®. Because of ongoing market volatility, performance may be subject to substantial short-term changes. Dividends are not guaranteed and a company’s future ability to pay dividends may be limited. A company currently paying dividends may cease paying dividends at any time. There is no assurance that dividend-paying stocks will mitigate volatility. CFA® is a registered trademark owned by the CFA Institute. Russell Investment Group is the source and owner of the trademarks, service marks and copyrights related to the Russell Indices. Russell® is a trademark of the Frank Russell Investment Group. Data sourced from FactSet: Copyright 2024 FactSet Research Systems Inc., FactSet Fundamentals. All rights reserved. Heartland’s investing glossary provides definitions for several terms used on this page. |
Editor’s Note: The summary bullets for this article were chosen by Seeking Alpha editors.
Editor’s Note: This article discusses one or more securities that do not trade on a major U.S. exchange. Please be aware of the risks associated with these stocks.


