

Alistair Berg
Dear Fellow Shareholders,
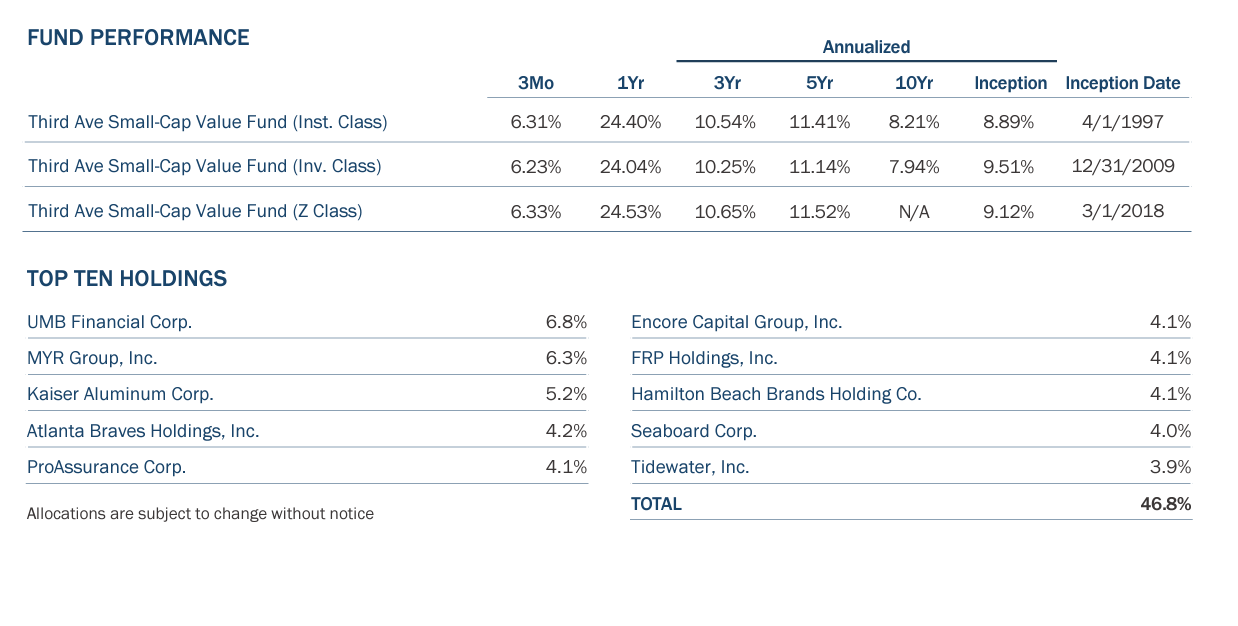
For the first quarter of 2024, the Third Avenue Small-Cap Value Fund (the “Fund”) returned 6.31% versus 2.90% for the Fund’s most relevant benchmark, the Russell 2000 Value Index (the “Index”)1. It was a gratifying quarter as the Fund delivered solid absolute and relative returns to our shareholders.
Our five most significant performance drivers for the quarter were Hamilton Beach Brands (HBB) (up 40%), Tidewater (TDW) (up 28%), MYR Group (MYRG) (up 22%), Kaiser Aluminum (KALU) (up 27%), and Comfort Systems (FIX) (up 43%). Strong earnings coupled with modest investor expectations helped boost valuations. Four of the five companies highlighted above were top 10 holdings as of year-end 2023, illustrating our concentrated approach’s importance. Performance laggards included Washington Trust Bancorp (WASH), Encore Capital Group (ECPG), and Seaboard Corp. (SEB). However, we believe that in all cases, the thesis behind our investment decision is intact, and we expect to see valuations reflect our analysis over time.
During the period, small caps lagged large caps by a wide margin in the first quarter, continuing recent trends. The Russell 2000 Index, a commonly used small-cap proxy that peaked in November 2021 and remains more than 13% below the record-high price as of quarter-end! Over the past three years, the Russell 2000 Index has generated negligible returns, while the S&P 500 Index has compounded at an 11.6% rate. Market cycles change, and it seems reasonable to Fund Management that the continued outperformance by large caps is unsustainable and that the intrinsic value within the small-cap market will be realized.
Activity
We added no new positions during the quarter while boosting exposure to ProAssurance (PRA) and LSB Industries (LXU) as share prices lagged due to near-term operational challenges.
We sold our positions in Sphere Entertainment (SPHR) and Comfort Systems. The two closed positions highlight the nuances between managing the portfolio’s Long-Term Compounder investments (“LTC”) versus Time Arbitrage/Special Situation (“TA/SS”) positions (see Portfolio Strategy section below for more on these investment types).
In last quarter’s letter, we mentioned our disappointment in Sphere’s most recent convertible debt offering. In January, Sphere’s share price benefited from the publicity the venue received leading up to the Super Bowl in Las Vegas. It provided an opportunity to exit the position as the risk/return trade-off was no longer attractive.
Sphere Entertainment was a hallmark TA/SS position. We first invested over three years ago when it was part of the Madison Square Garden Entertainment (MSGE) conglomerate and before the Sphere spin-off. MSGE comprised disparate assets, and the capital structure changed considerably over the ownership period. It easily could have been thrown into the “too hard” pile. Instead, we valued each asset independently and opportunistically took advantage of valuation distortions in the post-spin-off period. Those actions allowed us to generate a 36% return on the investment. For TA/SS investments, we tend to be ruthless with valuation and managing the position. We usually exit the position when our conservative net asset values are realized.
|
Past performance is no guarantee of future results; returns include reinvestment of all distributions. The above represents past performance and current performance may be lower or higher than performance quoted above. Investment return and principal value fluctuate so that an investor’s shares, when redeemed, may be worth more or less than the original cost. For the most recent month-end performance, please visit the Fund’s website at www.thirdave.com. The U.S. Lipper Fund Award for Best Equity Small Fund Family is based on a review of 185 qualified fund management companies that were eligible for the three-year period ending on 11/30/23. To qualify for Lipper’s Overall Small Fund Family Group Award, Small fund family groups must have at least three equity portfolios. The group award will be given to the group with the lowest average decile ranking of its respective asset class results based on the three-year Consistent Return measure of the eligible funds. From LSEG Lipper Fund Award© 2024 LSEG. All rights reserved. Used under license. |
While Sphere exemplifies a TA/SS investment, Comfort Systems was an ideal LTC position. We affectionately labeled Comfort Systems a “thin file” investment, meaning there was little drama attached to the thesis, and Comfort Systems quietly compounded book value over time. It is a low-margin business, yet it generates cash flows, and its management prudently allocates capital. Comfort Systems was owned by the Fund for over seven years and compounded shareholder return at a prodigious 37% annual rate over the ownership period. Comfort’s end markets, management team, culture, and compensation systems checked our boxes. We sold the position as Comfort Systems grew its market capitalization to $9 billion. Thus, it was no longer a small cap. It was an exceptional investment for Fund shareholders. We wish the company continued success and are grateful for their efforts.
Portfolio Update
There were 23 positions in the Fund at quarter-end, down from 25 on December 31, 2023. As a reflection of the sales listed above, cash at quarter-end stood at approximately 14.7%, up from 6.5% on December 31, 2023. Given our concentrated strategy, cash can be deployed quickly.
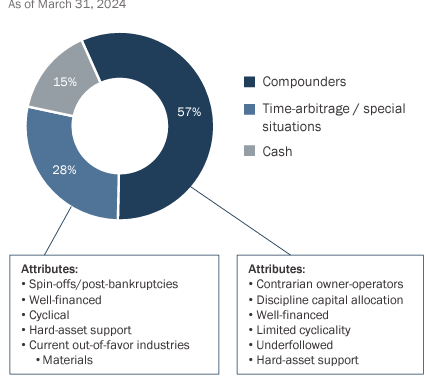
In our approach to portfolio construction, Fund Management categorizes holdings as either LTC or TA/SS positions based on the companies’ characteristics. At the end of the first quarter, LTC represented approximately 57% of the portfolio, and TA/SS positions represented approximately 28%.
The Fund’s LTC category (or “bucket”) includes companies such as Seaboard (SEB) (conglomerate), MYR Group (engineering and construction), and FRP Holdings (FRPH) (real estate developer/aggregates). We believe balance sheet strength and prudent capital allocation should allow these companies to compound net asset value for many years to come. Financial services companies are roughly half the LTC category, and well-capitalized regional banks comprise 16% of the total portfolio.
The TS/SS bucket is predominantly comprised of aluminum company Kaiser Aluminum, real estate-related holdings such as InvenTrust Properties (IVT), and other out-of-favor, misunderstood companies such as specialty chemical company LSB Industries. These companies are cyclical or misunderstood, and given their strong financial positions, Fund Management believes they have the luxury of time and capital to invest and grow until the clouds dissipate.
The Fund’s weighted-average discount to our mid-case, conservative net asset value (“NAV”) estimates rose marginally to 9.4% from 6% in the fourth quarter.
The following is a visual overview of the portfolio:
Asset Allocation
Portfolio Strategy
“The challenge of successfully managing an investment portfolio goes beyond making a series of good individual investment decisions.”
– Seth Klarman, Portfolio Manager, the Baupost Group
Our investors often ask about the performance attribution of the LTC and TA/SS buckets, hoping to understand how they work together to generate returns and manage risk.
There is a consistent approach to security selection in all cases where we invest in well-capitalized companies encountering near-term struggles that trade at a deeply discounted price. As a portfolio management tool, we “bucket” the securities based on their characteristics after purchase.
LTC companies are usually decent businesses that face company-specific issues. The holding periods in this bucket are longer. The TA/SS companies tend to be spin-offs, deeply cyclical, or undergoing some manner of restructuring. We are much more proactive in managing these positions. We usually exit once the thesis plays out and the value is realized.
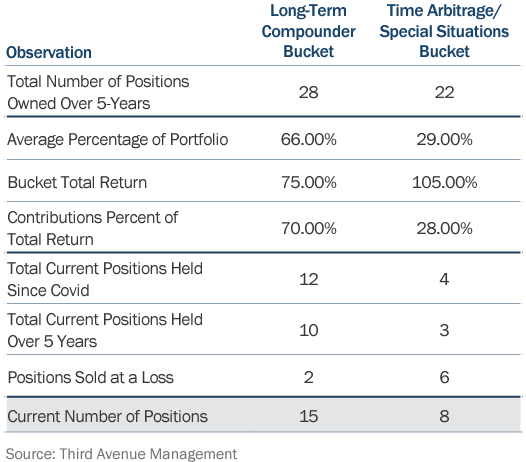
Fund Management formalized a tracking system for our bucketing methodology in early 2019. Since we now have five years of data to analyze, and clients asked about it, we reviewed and analyzed the performance. The Fund has generated an 11.4% annualized net of fee return over the last five years, and the results of our study of the individual buckets affirmed our investment strategy.
Following is a summary of our findings: 4/1/2019 – 3/31/2024
Past performance does not guarantee future results.
Allocation
The average LTC compounder allocation has been 66% over the past five years. This aligns with our projection that the split between the two buckets should be two-thirds LTC versus one-third TA/SS. We aim to allocate twice as much capital to LTCs as we believe those securities have more predictable investment outcomes. The TA/SS allocation is cyclical and will tend to rise in times of market stress when cyclical companies often become deeply undervalued. Given that market returns have been healthy over the past five years, it is unsurprising that the 29% allocation to the TA/SS bucket has been slightly below average.
Contribution
LTC’s have provided 70% of the total returns over the past five years. This is slightly higher than the average portfolio allocation yet in line. Although the LTC’s performed slightly better than expected overall, exploring how the buckets performed during recent specific periods was revealing. LTC’s were standout performers during the Covid period while the time arb/special situation bucket lagged. In 2022, both performed well. In 2023 when markets were strong, the TA/SS bucket provided 61% of returns. This is exactly the profile we seek with the TA/SS investments enhancing overall performance and the LTC bucket compounding value over time while providing a ballast in stressed markets. We understand the range of outcomes is wider in the TA/SS bucket and that these securities are most at risk during market selloffs. Through position sizing and strictly investing in well-capitalized companies, those investments tend not to dominate performance during challenging economic cycles.
We also calculated returns on investment for each bucket. The TA/SS bucket generated a 105% cumulative total return, exceeding the 75% cumulative return on the LTC bucket over the trailing five-year time horizon. This is consistent with our strategy as the return potential is higher in the TA/SS bucket, but it also has more risk. Given our pursuit of high-risk adjusted returns, the TA/SS bucket is managed with shorter time horizons and smaller position sizes. This explains why the returns on investment are higher, yet the overall contribution to total returns is lower.
Turnover
Fund Management believes in a low-turnover strategy overall, and the activity within each bucket is in line with expectations. The LTC bucket has experienced little activity. Of the 28 positions owned over the past five years, 10 have been held for over five years, and a dozen have been in the portfolio since Covid. We isolated the pandemic period since the volatility at that time resulted in elevated turnover. Of the 12 LTC positions exited, two companies were acquired, and five outgrew our small-cap mandate. All but two were profitable investments. Over the past five years, the overall portfolio turnover has been roughly 20%. The strength and durability of the LTC bucket is a key reason. As expected, there was more turnover in the TA/SS bucket. The Fund added 22 positions to the TA/SS bucket over the past five years. That’s almost as many as the LTC bucket despite having fewer positions overall. The companies in this bucket usually are deeply out of favor, or the thesis is linked to an event to realize value. Only three companies have been in the Fund over the five-year period, and we have held four since the pandemic. The higher turnover results from valuations changing rapidly and our discipline about exiting positions that reach our NAV targets.
Positions Sold at a Loss
Going through this process and looking at what did not work was enlightening. During the pandemic, we sold two banks at a loss after determining their balance sheets were not as strong as the other financial companies the Fund held. In one case, the company has grown book value by a double- digit rate since our exit. The other bank has struggled to scale, and its intrinsic value remains flat.
There were six mistakes in the TA/SS bucket. This is not surprising because the companies in this bucket tend to be cyclical and have less control over their destiny. In three cases, we observed balance sheets deteriorating, resulting in capital structures that made us uncomfortable, given the underlying cyclicality. The other investments were exited after we lost faith in the company’s ability to realize our thesis. Given we strictly manage risk in these positions, we were willing to fail quickly, and the position sizes were below average. Despite a higher absolute number of losses, the profit contributions from this bucket have been in line with the portfolio exposure over time.
Conclusion
Fund Management takes portfolio construction seriously. The Fund has produced alpha over the last five years while experiencing less volatility than our Index and peers, achieving the goal of delivering high-risk adjusted returns. We have followed the path originally outlined in our 2017 Manifesto. Risk management in security selection and portfolio construction is a never-ending process that will remain a top priority for Fund Management.
During the quarter, Third Avenue Management was named winner of the Best Equity Small Size Fund Family Group over Three Years at the 2024 United States LSEG Lipper Fund Awards. The Fund Family Awards recognize funds that have excelled and delivered consistently strong risk-adjusted performance relative to peers. The award is a testament to Third Avenue’s unconventional, balance sheet-first approach and the diligent efforts of our team.
We thank you for your continued support and look forward to writing to you again next quarter. In the interim, please don’t hesitate to contact us with any questions, comments, or ideas atclientservice@thirdave.com.
Sincerely,
Vic Cunningham
Important InformationThis publication does not constitute an offer or solicitation of any transaction in any securities. Any recommendation contained herein may not be suitable for all investors. Information contained in this publication has been obtained from sources we believe to be reliable, but cannot be guaranteed. The information in this portfolio manager letter represents the opinions of the portfolio manager(s) and is not intended to be a forecast of future events, a guarantee of future results or investment advice. Views expressed are those of the portfolio manager(s) and may differ from those of other portfolio managers or of the firm as a whole. Also, please note that any discussion of the Fund’s holdings, the Fund’s performance, and the portfolio manager(s) views are as of March 31, 2024 (except as otherwise stated), and are subject to change without notice. Certain information contained in this letter constitutes “forward-looking statements,” which can be identified by the use of forward-looking terminology such as “may,” “will,” “should,” “expect,” “anticipate,” “project,” “estimate,” “intend,” “continue” or “believe,” or the negatives thereof (such as “may not,” “should not,” “are not expected to,” etc.) or other variations thereon or comparable terminology. Due to various risks and uncertainties, actual events or results or the actual performance of any fund may differ materially from those reflected or contemplated in any such forward-looking statement. Current performance results may be lower or higher than performance numbers quoted in certain letters to shareholders. Date of first use of portfolio manager commentary: April 16, 2024 1 The Russell 2000® Value Index measures the performance of small-cap value segment of the US equity universe. It includes those Russell 2000® companies with lower price-to-book ratios and lower forecasted growth values. The Russell 2000® Value Index is constructed to provide a comprehensive and unbiased barometer for the small-cap value segment. The index is completely reconstituted annually to ensure larger stocks do not distort the performance and characteristics of the true small-cap opportunity set and that the represented companies continue to reflect value characteristic. Past performance is no guarantee of future results; returns include reinvestment of all distributions. The above represents past performance and current performance may be lower or higher than performance quoted above. Investment return and principal value fluctuate so that an investor’s shares, when redeemed, may be worth more or less than the original cost. For the most recent month-end performance please visit the Fund’s website at www.thirdave.com. The gross expense ratio for the Fund’s Institutional, Investor and Z share classes is 1.25%, 1.50% and 1.18%, respectively, as of March 1, 2024. Risks that could negatively impact returns include: fluctuations in currencies versus the US dollar, political/social/economic instability in foreign countries where the Fund invests, lack of diversification, volatility associated with investing in small-cap securities, and adverse general market conditions. The fund’s investment objectives, risks, charges, and expenses must be considered carefully before investing. The prospectus contains this and other important information about the investment company, and it may be obtained by calling 800-443-1021 or visiting www.thirdave.com. Read it carefully before investing. Distributor of Third Avenue Funds: Foreside Fund Services, LLC. Current performance results may be lower or higher than performance numbers quoted in certain letters to shareholders. Third Avenue offers multiple investment solutions with unique exposures and return profiles. Our core strategies are currently available through ’40Act mutual funds and customized accounts. If you would like further information, please contact our Relationship Manager. |
Editor’s Note: The summary bullets for this article were chosen by Seeking Alpha editors.


