
Southeast Asia has become more important to both Washington and Beijing, but its growing role also leaves the region more exposed to policy shifts in both capitals.
Key Takeaways
- ASEAN trade is increasingly organized around two external poles. China is the region’s largest trading partner—roughly one in every five dollars of ASEAN trade—and dominant source of factory inputs, while the United States is its fastest-growing major export market, with exports rising 37.5% between 2022 and 2025. Diversification away from China has not meant separation: much of the region’s manufacturing boom is built on Chinese inputs.
- ASEAN’s trade deficit with China has become structural. It reached a record $296 billion in 2025—more than double the 2023 level—and widened another 24% to $166 billion in the first half of 2026 as imports continued to outpace exports. The imbalance is concentrated in manufactured goods; and for the first time, all six major ASEAN economies are in the red with China.
- China’s export surge is reshaping both ASEAN’s factory base and its consumer markets. Electronics, machinery, and intermediate inputs drove much of the increase—chip shipments from China more than doubled in the first half of 2026—while ASEAN’s own value added in global supply chains is also rising. The surge is also reaching consumers: Chinese vehicle exports to ASEAN rose 45% in 2025, led by electric vehicles, whose export value nearly doubled to $8.2 billion as part of a wave of clean-tech exports.
- The balancing act is getting harder. ASEAN governments are trying to avoid high U.S. tariffs, manage the effects of China’s export surge, and maintain access to the Chinese inputs that keep their own exports competitive—three objectives that are increasingly difficult to reconcile. The central question is whether the region can keep benefiting from its position at the intersection of both systems without becoming more vulnerable to each.
Global trade is not collapsing under fragmentation. It is being rerouted and rewired, and Southeast Asia is one of the clearest examples of that shift.
As companies and governments seek alternatives to China, ASEAN economies have gained a larger role in global supply chains, attracted foreign investment, and expanded exports to the United States. But diversification away from China has not meant separation from China. Much of the region’s manufacturing boom is increasingly built on Chinese inputs.
This creates a new dilemma. ASEAN economies are selling more to the United States while buying more components, machinery, electronics, clean technologies, and industrial goods from China. The same supply chains that make the region attractive as an alternative production base also expose it to scrutiny from Washington over transshipment, rules of origin, and economic security.
Southeast Asia is therefore not simply replacing China in global supply chains. The data below demonstrates how the region is becoming a key intersection of U.S. demand, Chinese inputs, ASEAN production capacity, and the global buildout of AI infrastructure. ASEAN governments are trying to preserve access to both markets while also managing the risks of Chinese overcapacity, U.S. trade pressure, supply chain fragmentation, and geopolitical uncertainty.
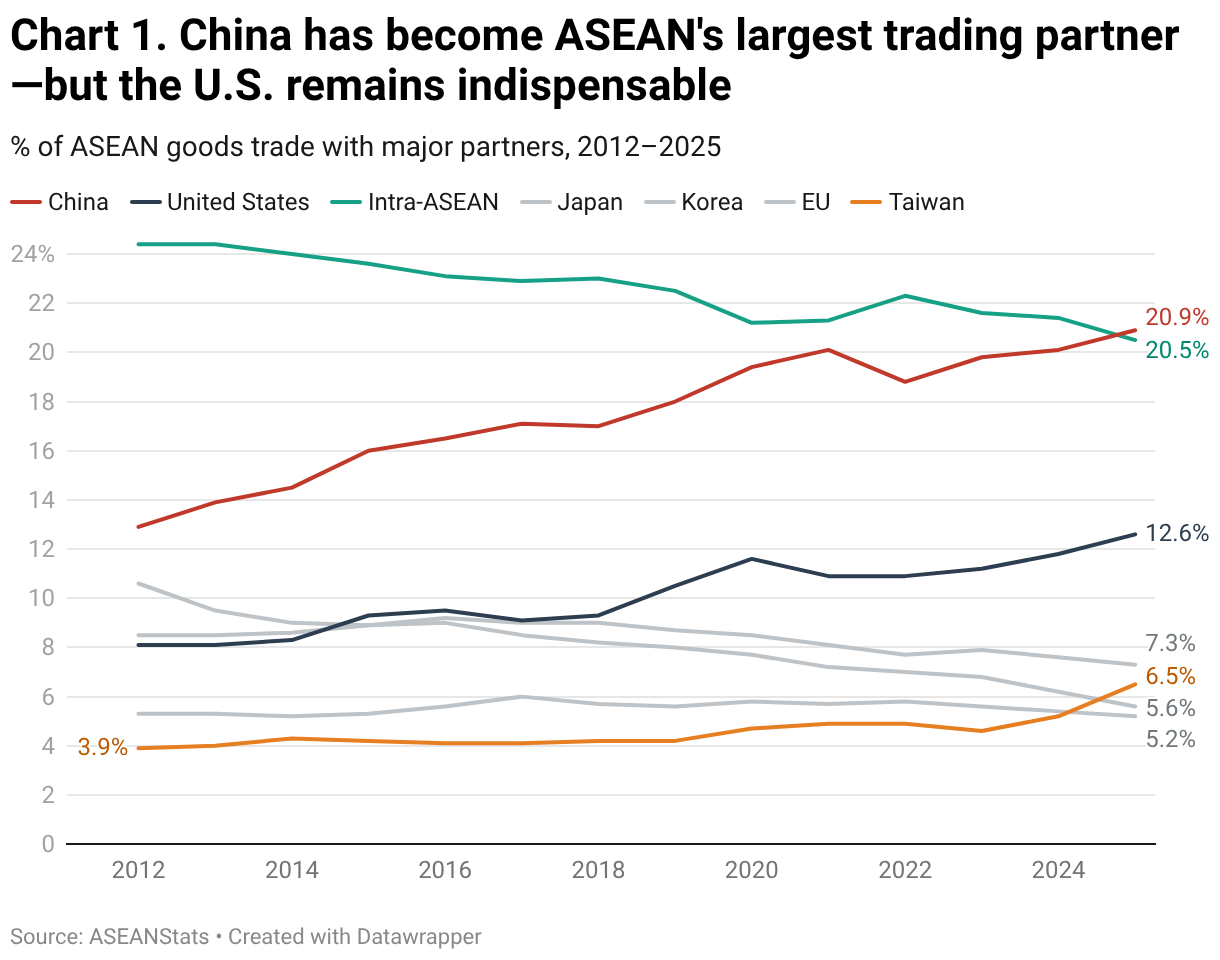
Southeast Asia’s trade map has been redrawn over the past decade. In 2012, intra-ASEAN commerce made up nearly a quarter of the region’s total trade. By 2025, China alone accounted for roughly one in every five dollars traded by ASEAN, while the U.S. share climbed above 12% and intra-regional trade slipped to just over 20%. Japan’s share fell by nearly half, Europe’s eroded, and Taiwan—riding the AI boom—surpassed Japan. ASEAN’s deepening dependence on China and the United States is the starting point for its current dilemma.
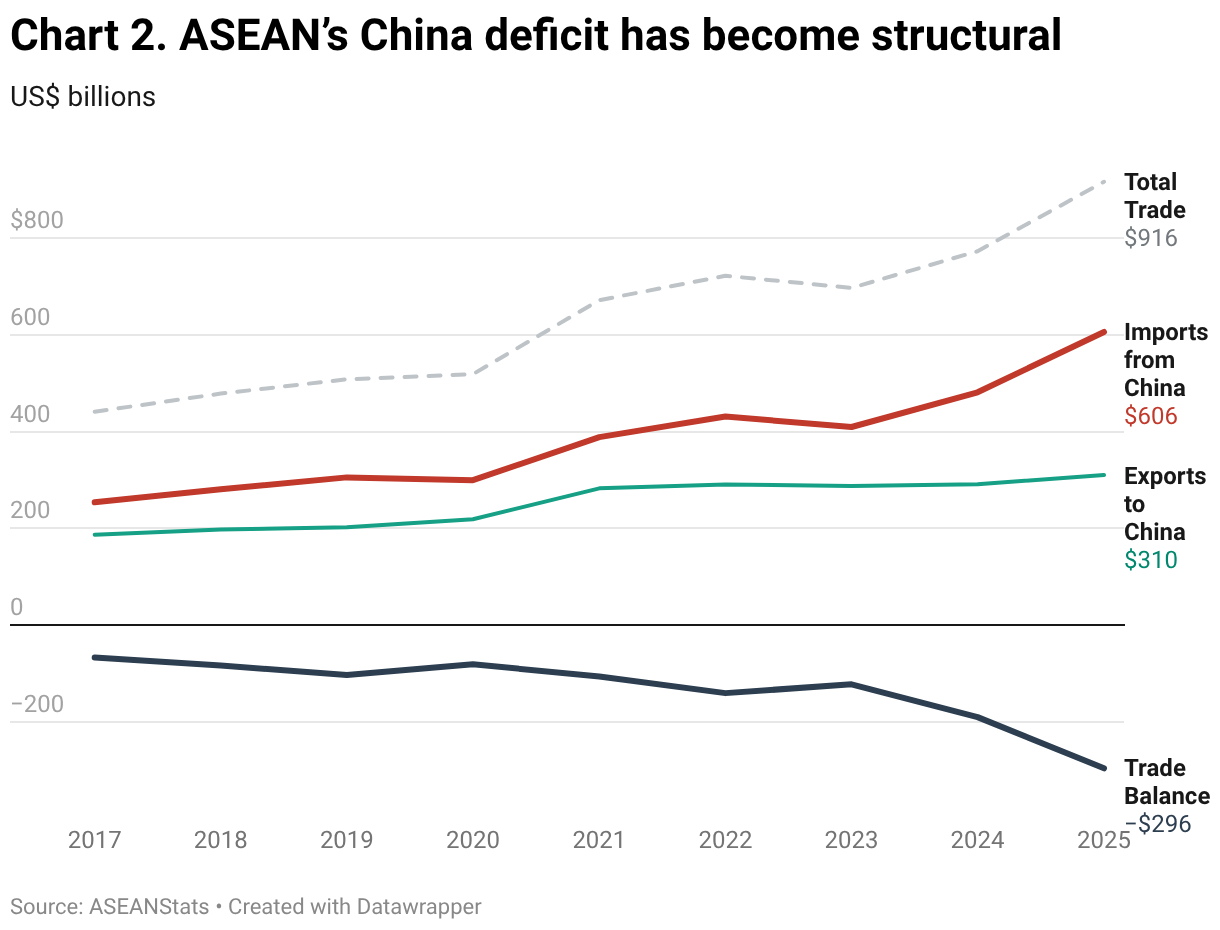
Beneath the headline numbers, China-ASEAN trade has become increasingly lopsided. ASEAN’s exports to China have plateaued since 2021, while imports from China have surged. The bloc’s trade deficit with Beijing hit a record $296 billion in 2025, more than double the 2023 level. The widening gap shows that deeper integration has produced an increasingly structural imbalance.
The regional imbalance is part of something larger. ASEAN’s bilateral deficit with China was equivalent to roughly a quarter of China’s $1.2 trillion global goods surplus in 2025. Southeast Asia is not the only region absorbing China’s export surge, but it has become one of the most significant outlets.
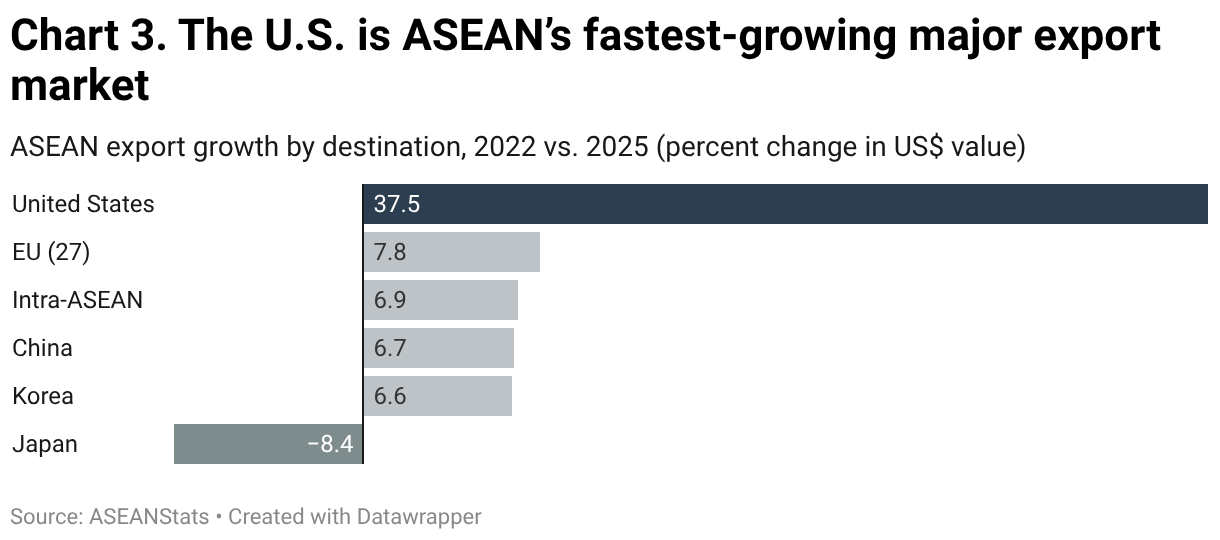
ASEAN has become more important to U.S. supply chains. Between 2022 and 2025, the region’s exports to the United States grew 37.5%—roughly five times the pace of exports to China, the EU, Korea, or intra-regional trade. Exports to Japan actually contracted. Despite the rhetoric of reshoring and the reality of escalating tariffs, the U.S. has been Southeast Asia’s most dynamic growth market by a wide margin. That momentum continued into 2026, with exports to the United States increasing 34% year over year in the first five months, according to U.S. Census data. Some of this growth reflects production shifting into ASEAN, even as the region’s exports increasingly rely on Chinese inputs—a pattern explored below.
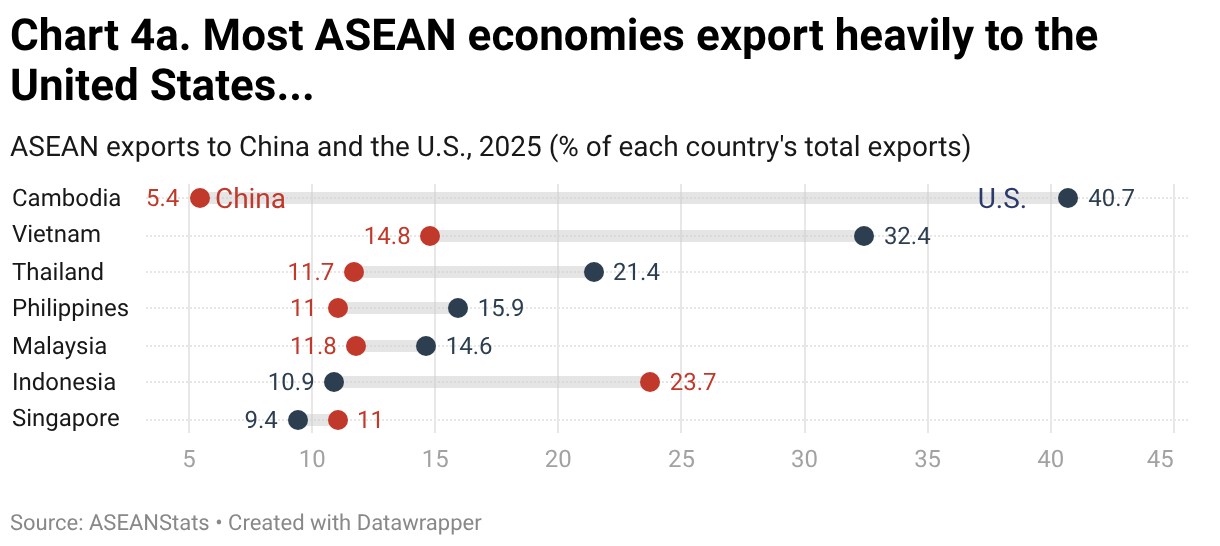
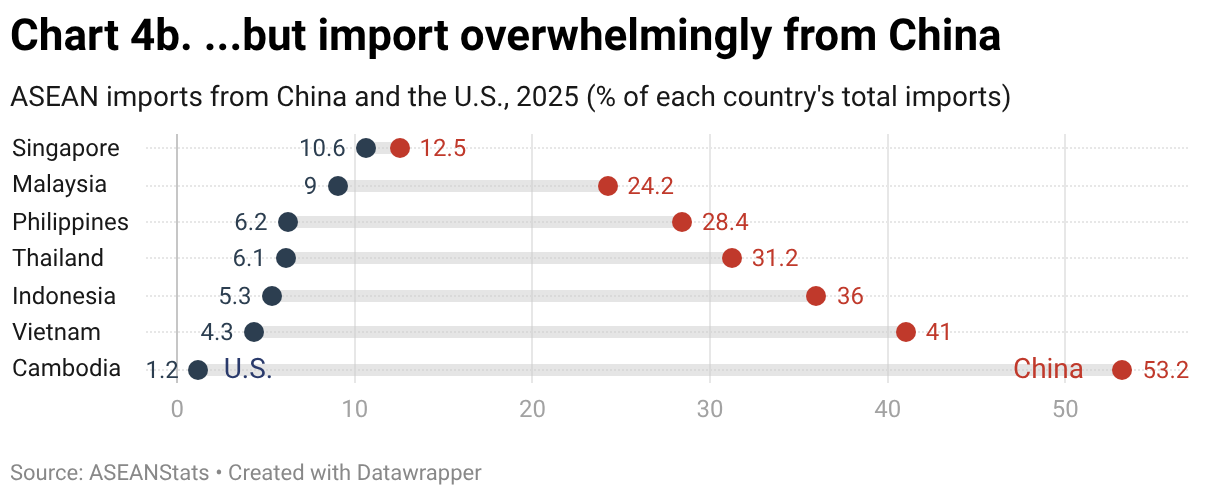
These regional dynamics become clearer at the country level. Cambodia sends more than 40% of its exports to the United States—overwhelmingly garments, footwear, and travel goods—while sourcing 53% of its imports from China, much of it the fabrics and components those same factories depend on. Vietnam shows a similar pattern, with 32% of exports going to the U.S. while 41% of imports arrive from China. Thailand, the Philippines, and Malaysia face milder versions of the same divide. Resource-rich Indonesia differs somewhat, counting China as both its largest supplier and its largest customer. Across the region, ASEAN economies rely on China as their primary supplier and the United States as a critical export market.
The Import Surge
ASEAN’s widening deficit with China reflects a deeper shift in the region’s manufacturing model. Three patterns stand out: the increase is concentrated in industrial sectors; the imbalance is greatest in manufactured goods; and Chinese intermediate inputs are becoming more deeply embedded in ASEAN production.
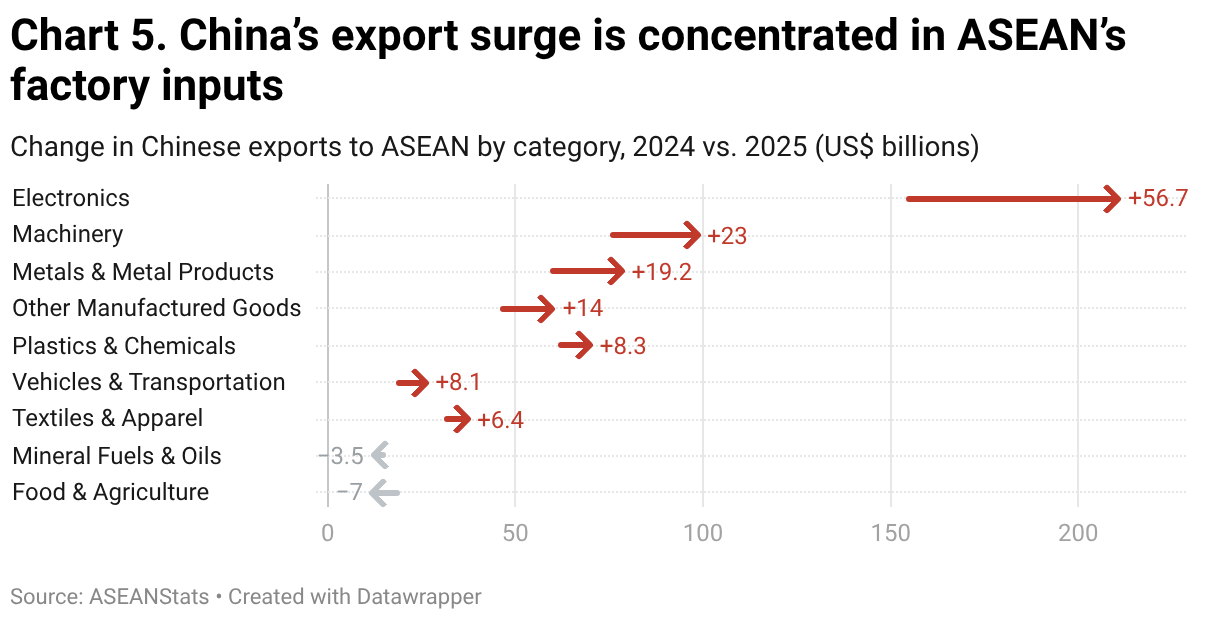
China’s export growth to ASEAN in 2025 was not broad-based. It was concentrated in the categories that matter most for manufacturing. Electronics imports jumped by $57 billion in a single year, a 37% increase. Machinery rose 30%, metals 32%, and vehicles 45%. Only food and fuels declined. The composition of the increase shows that much of the latest wave of Chinese exports is feeding directly into ASEAN manufacturing, though it also includes a growing volume of finished goods.
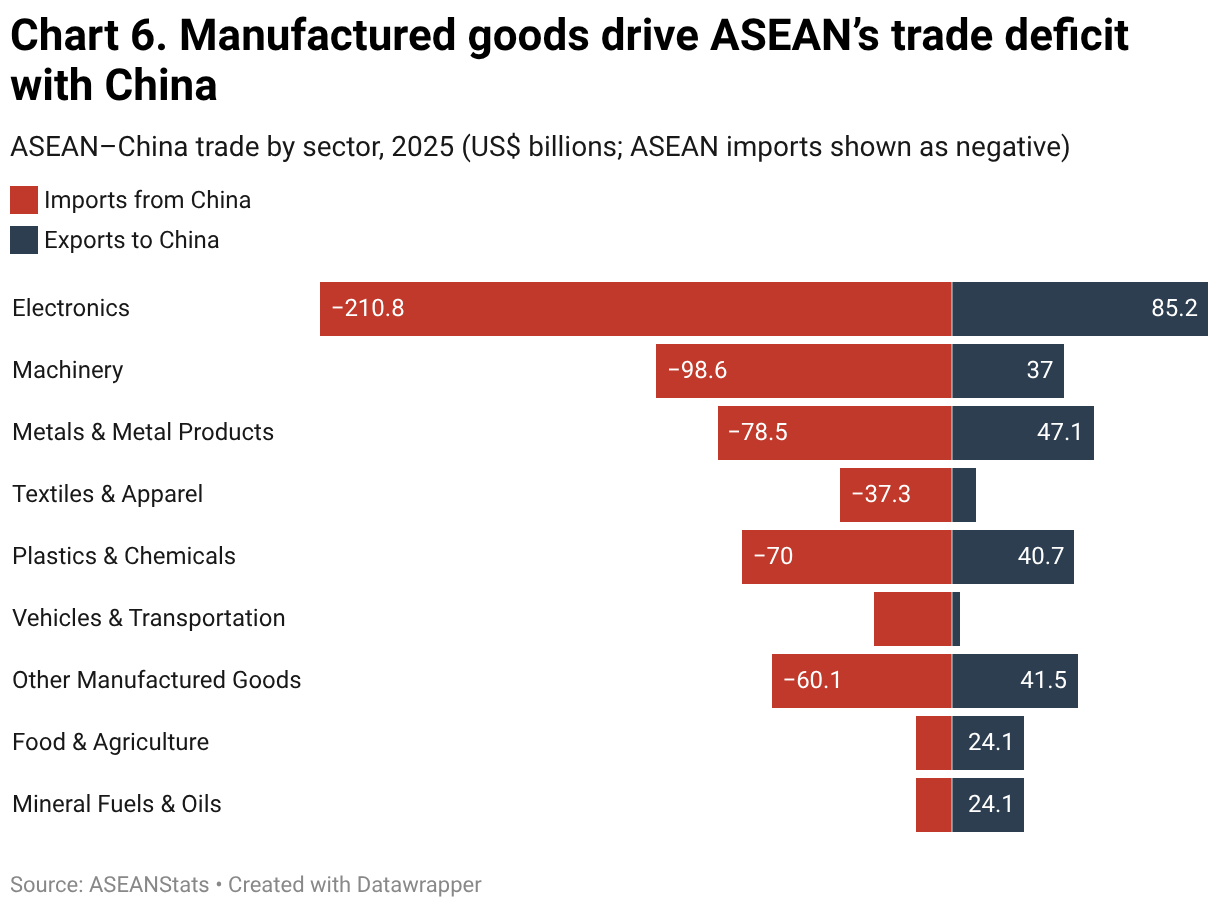
ASEAN’s trade imbalance with China is concentrated in manufactured goods. In every major industrial category—including electronics, machinery, metals, chemicals, textiles, and transport equipment—the region imports substantially more from China than it exports in return. Electronics alone accounts for a deficit of roughly $126 billion, followed by machinery at about $62 billion. ASEAN’s surpluses are largely confined to food, agriculture, and fuels.
This pattern points to an increasingly asymmetric production relationship. China supplies many of the components, machines, and industrial materials used by ASEAN factories, while buying a narrower range of commodities and upstream goods from the region. These flows strengthen ASEAN’s manufacturing base and export competitiveness, but it also deepens dependence on Chinese inputs.
Federal Reserve researchers describe the broader pattern as an asymmetric trade shock: China’s industrial exports are expanding faster than its demand for manufactured imports.
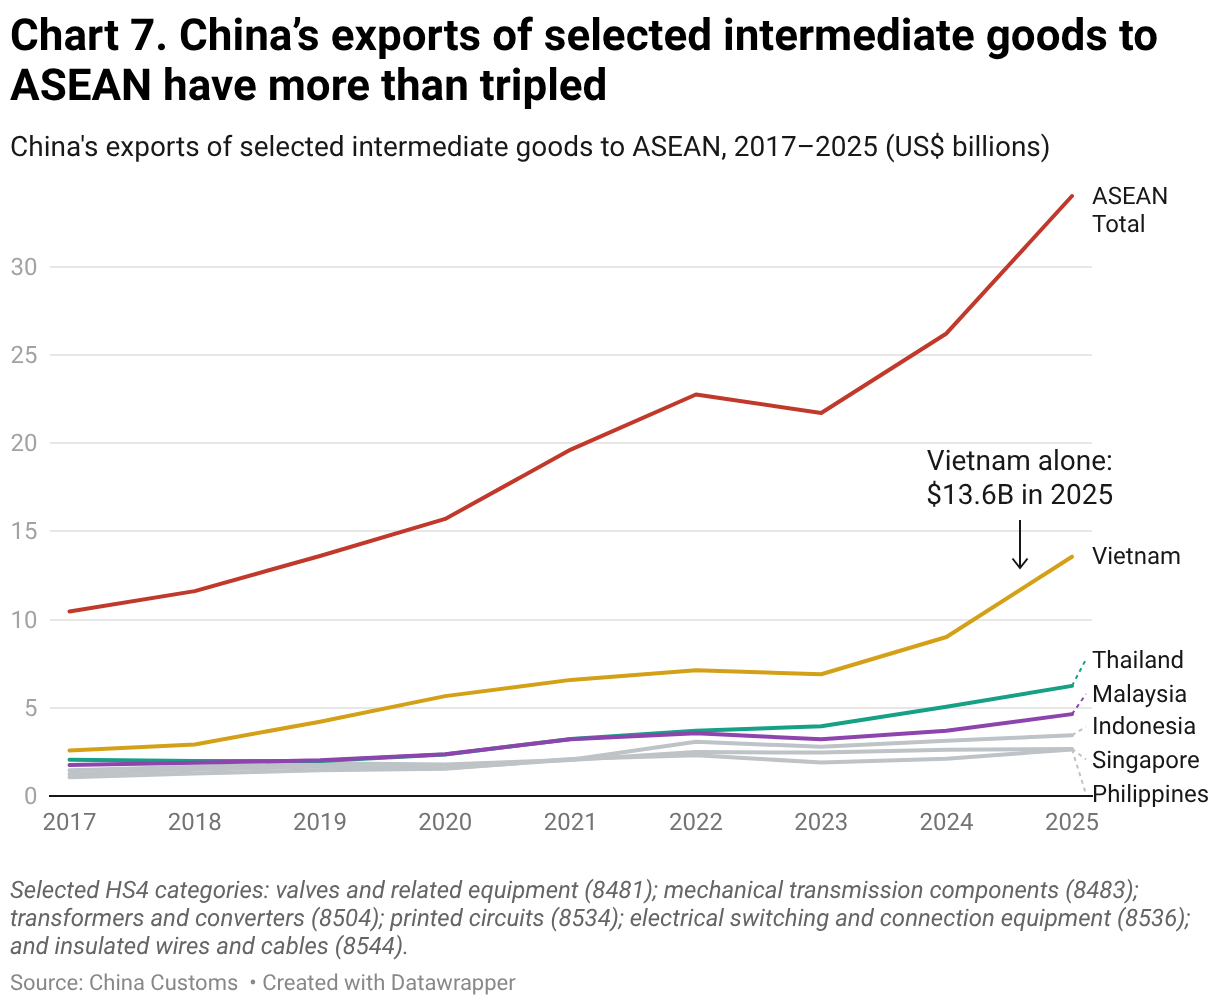
A closer look at selected manufacturing inputs—such as printed circuits, electrical switching and connection equipment, cables, transformers, valves, and mechanical transmission components—shows how rapidly these flows have grown. Chinese exports in this basket rose from $10.5 billion in 2017 to $34 billion in 2025. Vietnam alone accounted for $13.6 billion, roughly two-fifths of the regional total, while shipments to the region’s other major manufacturing economies also increased.
U.S. data point to the same supply-chain reconfiguration. Between 2024 and 2025, the U.S. machinery and electronics deficit with China narrowed by about $70 billion, while its deficit with ASEAN widened by roughly $80 billion. However, the shift cannot be reduced to rerouting. An IMF working paper finds that exports from several ASEAN economies in product categories affected by the U.S.-China tariffs continued to outperform other exports through 2022–2023 and expanded beyond the U.S. market. It also finds that ASEAN’s own contribution to global value chains (GVC) increased alongside the growing use of foreign inputs. This suggests capacity expansion within production networks that remain closely tied to China.
Investment data reinforce the shift but also show its limits. UNCTAD estimates that FDI inflows to Southeast Asia rose nearly 10% in 2025, to $244 billion, although much of the increase was concentrated in Singapore. Yet the pipeline of new projects weakened: announced greenfield investment fell for a second straight year, to $106 billion—more than 40% below its 2023 peak—while announced investment in GVC-intensive manufacturing more than halved, from $31 billion to $14 billion. At the same time, investment remained concentrated in strategic sectors including semiconductors, electronics, AI infrastructure, and data centers. The contrast suggests that trade reallocation is currently moving faster than the pipeline of new manufacturing investment.
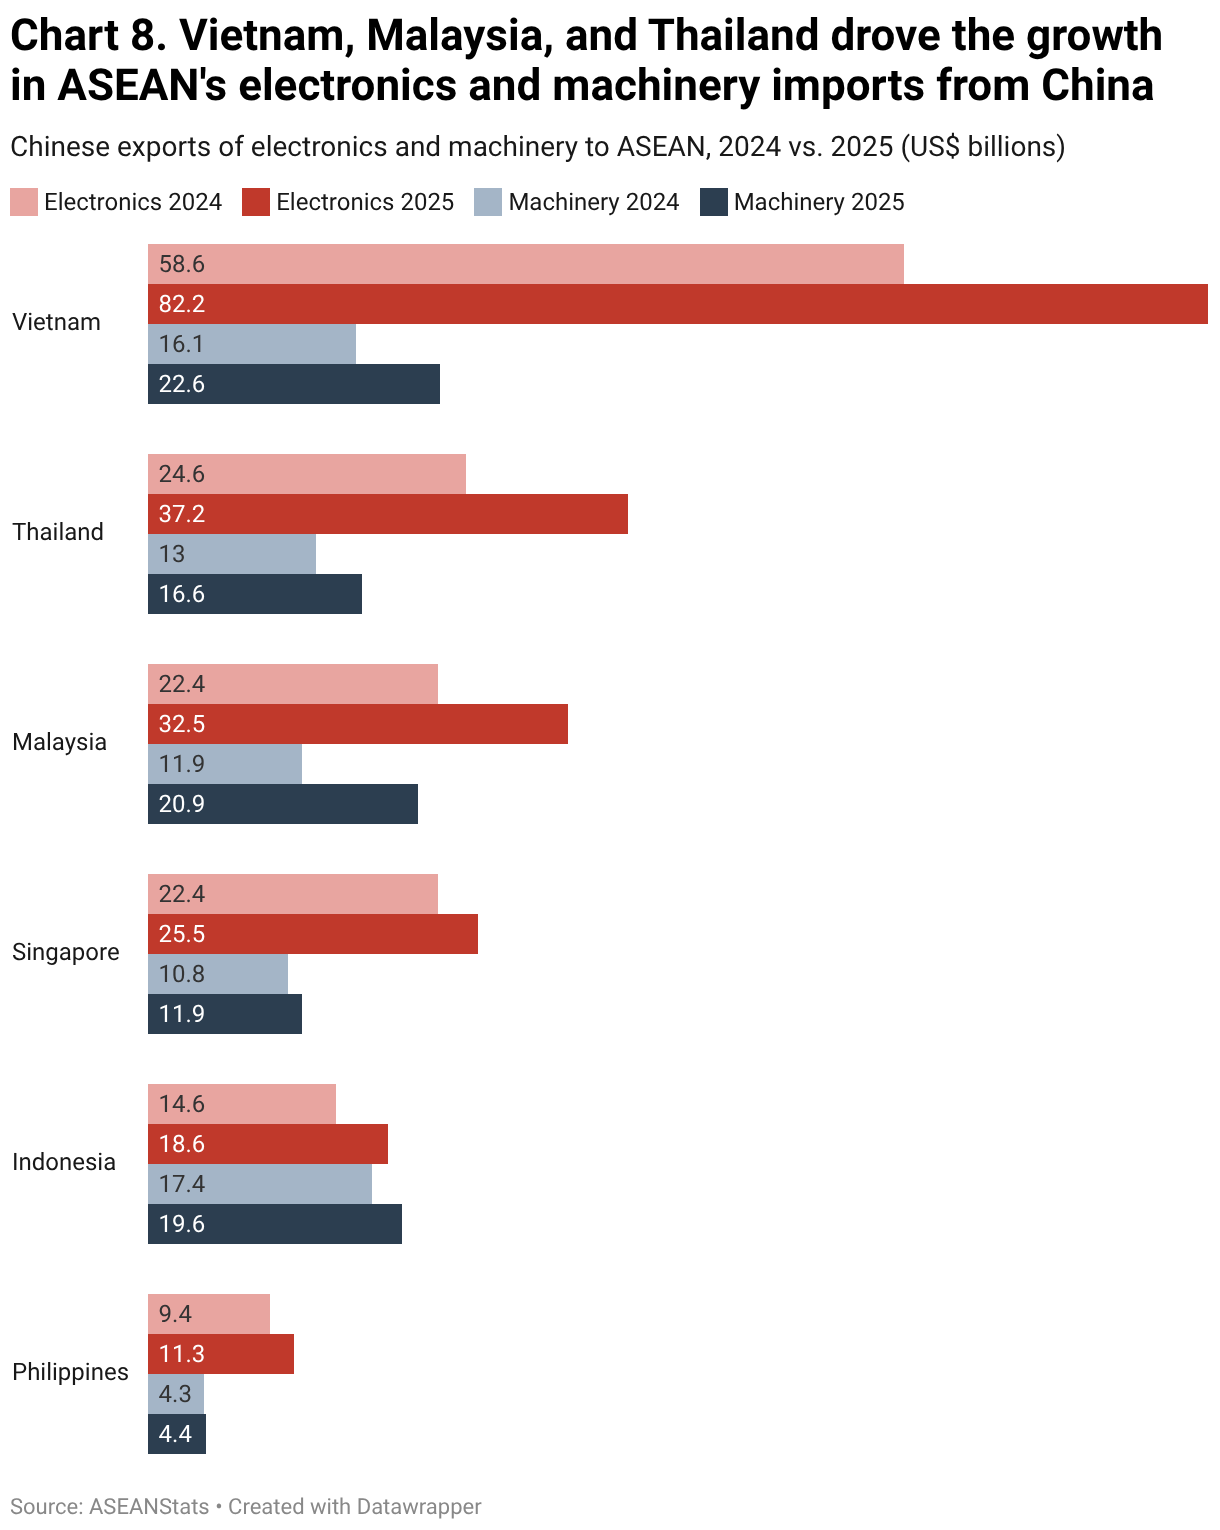
ASEAN’s imports of Chinese electronics and machinery rose from $230 billion in 2024 to $309 billion in 2025—an increase of nearly 35% in a single year, with growth concentrated in the region’s largest manufacturing centers. Vietnam recorded by far the largest rise, with combined electronics and machinery imports rising by roughly $30 billion, followed by Malaysia at about $19 billion and Thailand at more than $16 billion. Together, the three economies accounted for more than four-fifths of the ASEAN-wide increase.
The composition varied by market. Electronics accounted for most of the increase in Vietnam and Thailand, with Thailand’s electronics imports rising by more than half. Malaysia stood out for the rapid growth of its machinery imports, which climbed 76%, although electronics contributed slightly more to its increase in dollar terms. Increases in Singapore and Indonesia were more moderate, while the Philippines’ growth came almost entirely from electronics.
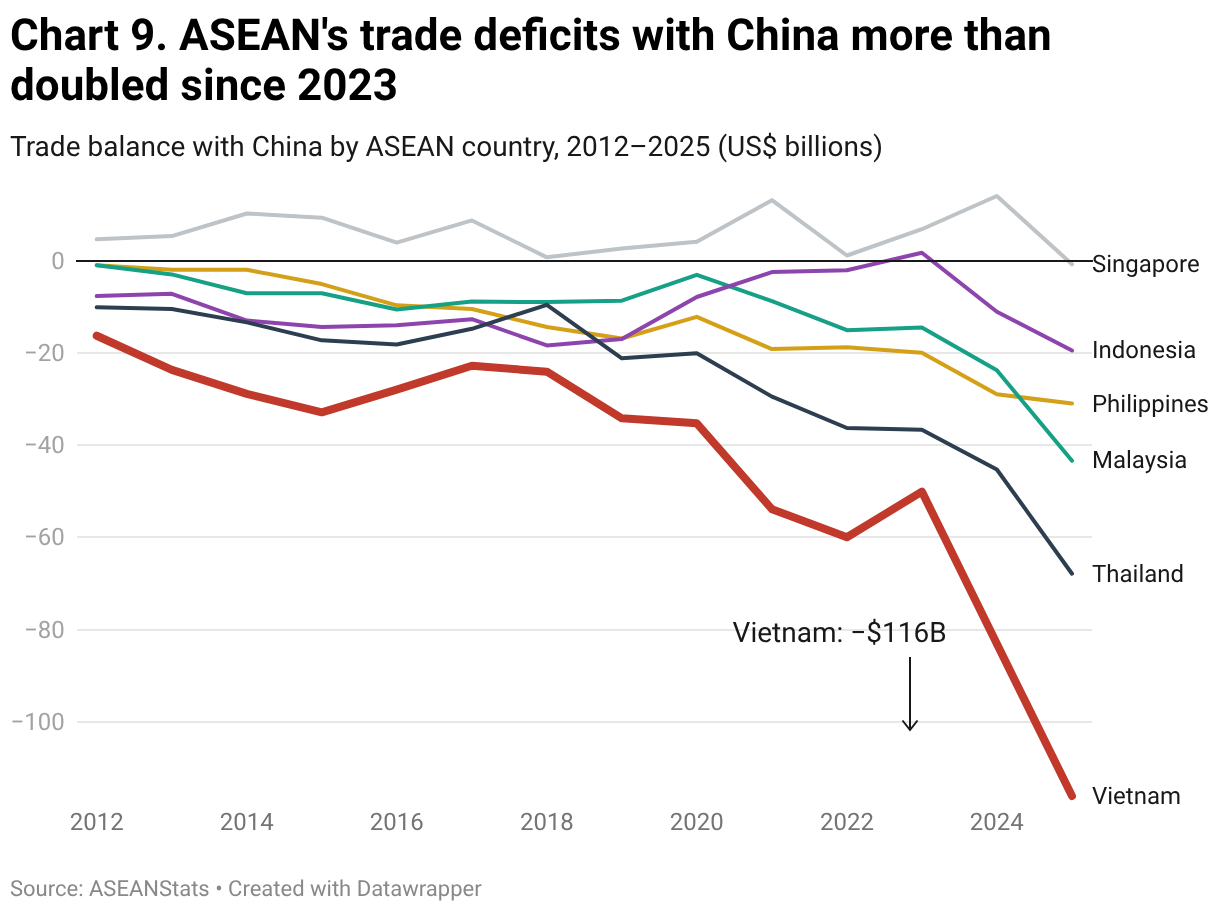
ASEAN’s aggregate trade deficit with China rose from $123 billion in 2023 to $296 billion in 2025. Over those two years, Vietnam’s deficit more than doubled to $116 billion, Thailand’s nearly doubled to $68 billion, and Malaysia’s nearly tripled to $43 billion. The imbalance is regional in scale, but its political consequences are national.
Beyond the three largest deficits, the trajectories diverged. Indonesia moved from a small surplus in 2023 to a deficit of nearly $20 billion in 2025, while the Philippines’ deficit widened more gradually. Singapore, the only economy shown to remain in surplus through 2024, slipped into a small deficit in 2025—leaving all six in the red with China for the first time.
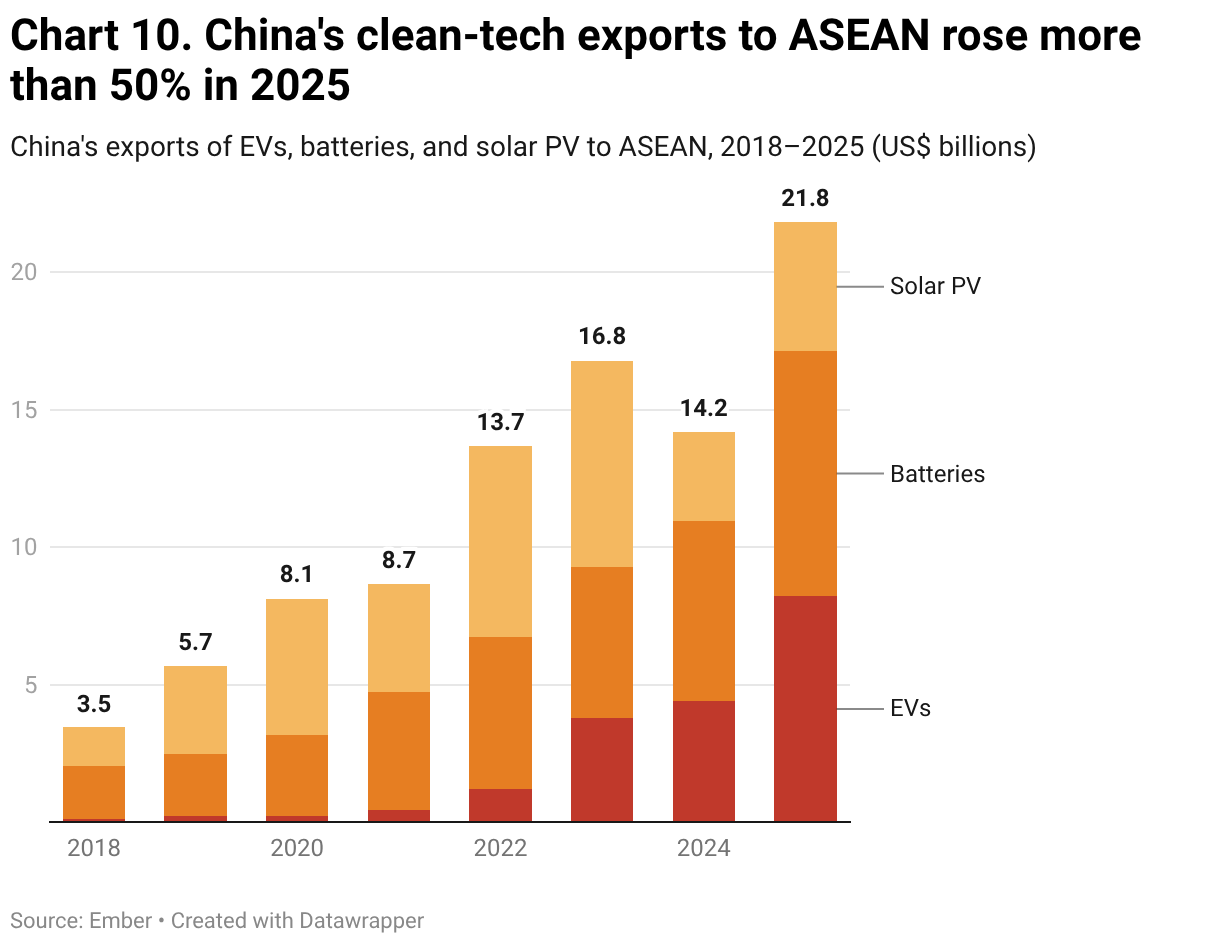
Chinese exports of electric vehicles, batteries, and solar panels to ASEAN totaled nearly $22 billion in 2025, up by over 50% from roughly $14 billion a year earlier and more than six times the 2018 level. EV exports nearly doubled to $8.2 billion and accounted for half of the one-year increase. Battery exports rose by 36% to nearly $9 billion, while solar panel shipments climbed 46% to $4.7 billion, though they remained more than a third below their 2023 peak.
In the first six months of 2026, Chinese exports across the three categories totaled $14.7 billion—57% more than during the same period in 2025. Growth was broad-based: solar-panel shipments more than doubled, battery exports rose by 48%, and EV exports grew 43%. The surge was already underway before the disruption of Gulf oil and gas flows through the Strait of Hormuz in March, but the resulting energy shock has strengthened the case for renewable-energy deployment across Southeast Asia.
Clean technology exports present ASEAN governments with a different policy tradeoff from the intermediate-goods imports discussed above. Greater access to Chinese EVs, batteries, and solar panels can lower the cost of the region’s energy and transportation transitions. At the same time, rapid import growth intensifies competition for local producers and complicates governments’ efforts to build domestic clean-technology industries and capture more of the associated value added.
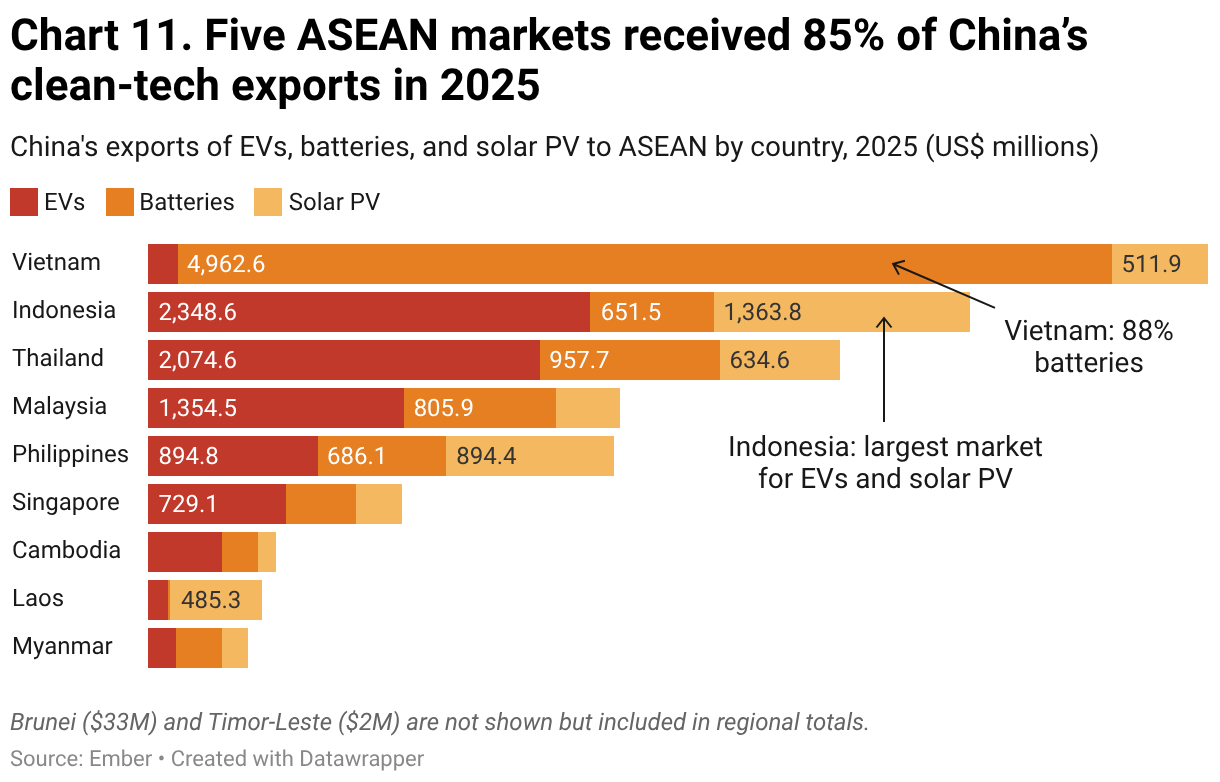
China’s clean-tech exports to ASEAN were concentrated both geographically and by product. Vietnam, Indonesia, and Thailand accounted for more than 60% of the 2025 total; adding Malaysia and the Philippines raises the share to 85%. Vietnam was the largest destination, receiving $5.6 billion, with batteries accounting for 88% of the total. Indonesia was the leading market for both Chinese EVs and solar panels, while EVs also made up more than half of shipments to Thailand and Malaysia. The Philippines received nearly equal amounts of EVs and solar panels—making it the region’s second-largest destination for Chinese solar—while Laos’ smaller total was dominated by solar.
The differences indicate distinct national roles in the region’s emerging clean-tech economy. Vietnam’s trade is overwhelmingly battery-focused; Indonesia, Thailand, Malaysia, and Cambodia are more oriented toward EVs; and solar plays a particularly large role in the Philippines and Laos. ASEAN governments are therefore not confronting a uniform regional trade pattern but different combinations of industrial competition, supply chain integration, and energy demand.
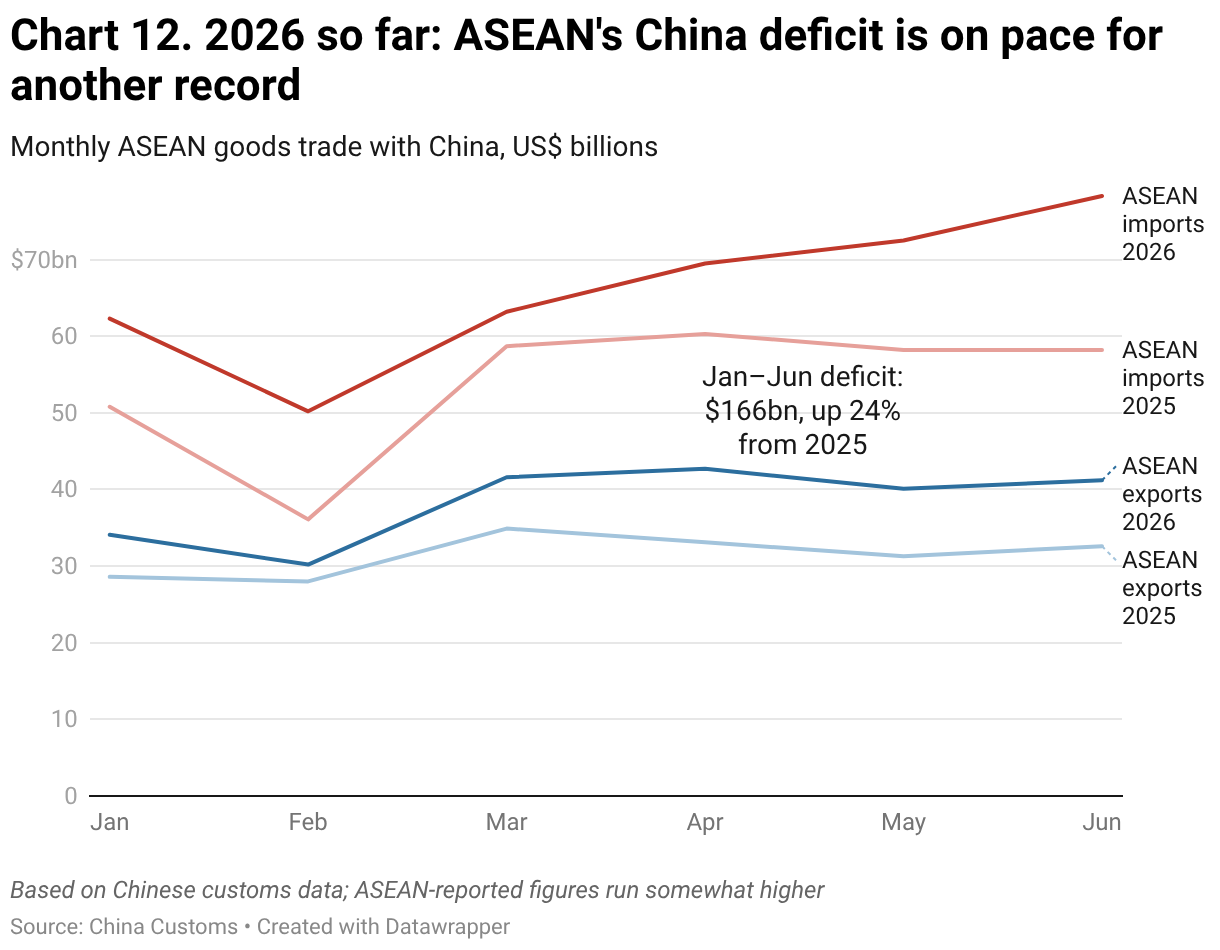
ASEAN–China trade accelerated further in the first half of 2026. Chinese customs figures show two-way trade rising by more than a fifth from a year earlier, with ASEAN’s imports from China up 23% and its exports to China growing 22%. However, since imports started from a much larger base, ASEAN’s deficit still widened to $166 billion in January–June—up 24% and on course for another record.
The pattern varies across countries. Vietnam’s exports to China jumped 40%, led by computers and parts supporting China’s AI buildout—yet its first-half deficit still reached $56 billion, the region’s largest. Thailand’s deficit widened fastest, up more than 40% to $36 billion, and Malaysia swung from a rough balance to a $28 billion shortfall as its chip and fuel sales to China fell. The exceptions took different forms: Indonesia swung into surplus on stronger energy sales, while Singapore’s exports to China rose by half—the fastest growth in the region, driven largely by chips and semiconductor manufacturing equipment—narrowing its deficit.
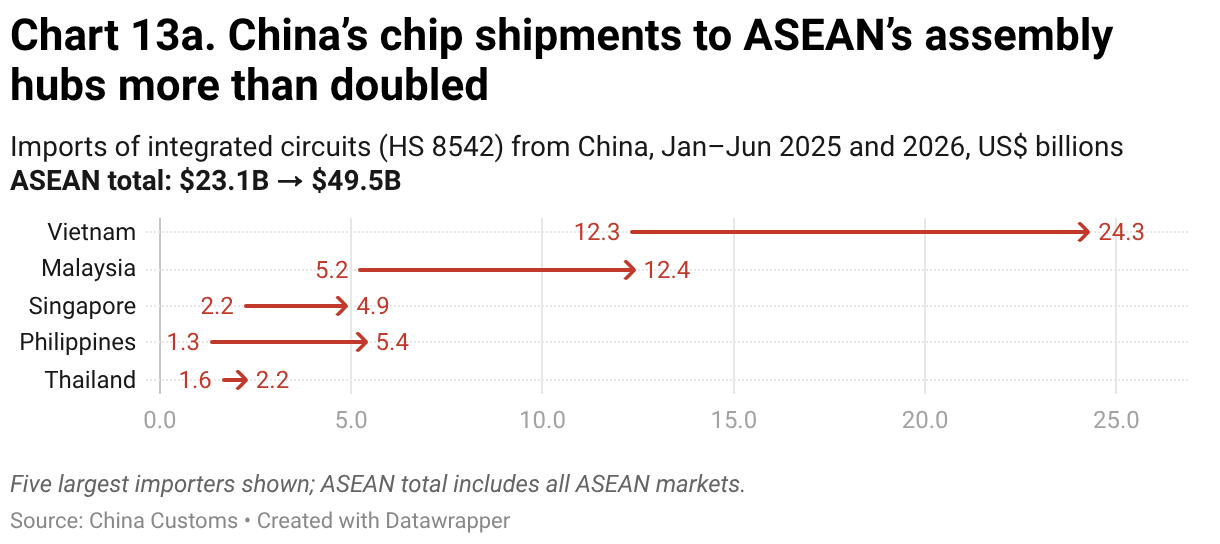
Behind the aggregate deficit, one of the region’s most strategic supply chains shifted rapidly in the first half of 2026. ASEAN’s imports of chips from China—classified in the trade data as integrated circuits, or HS 8542—reached $49.5 billion, up 114%. The increase accounted for more than a third of the overall rise in ASEAN’s imports from China and over half of the growth in electronics imports. Driven in part by the wider AI hardware boom, shipments rose sharply to the region’s major assembly hubs, led by Vietnam, Malaysia, and the Philippines.
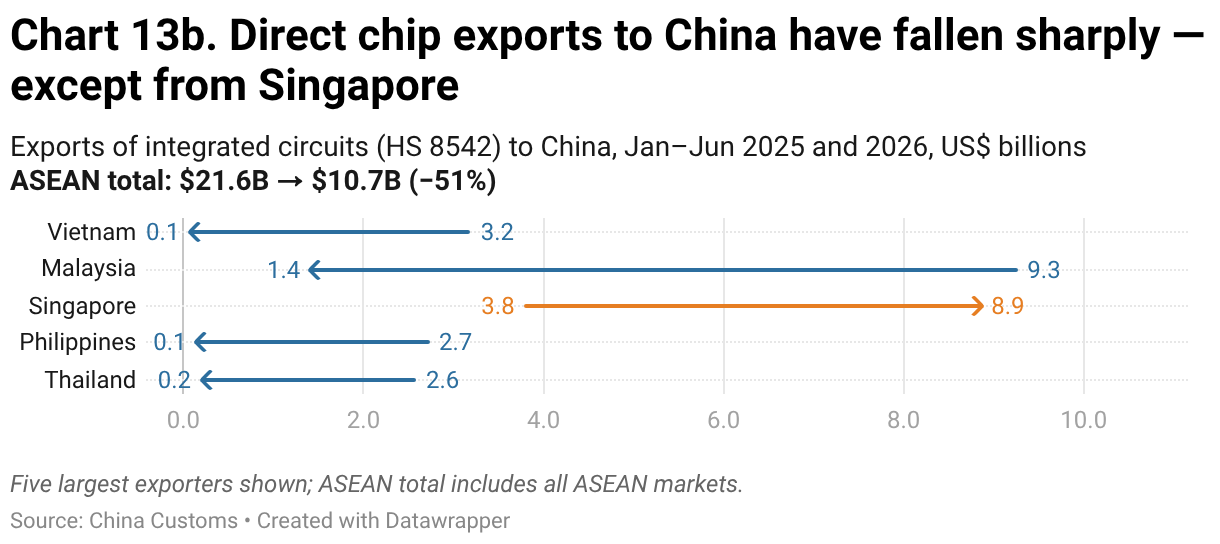
ASEAN’s direct chip exports to China moved in the other direction, falling by more than half, from $21.6 billion to $10.7 billion. Exports declined in every major market except Singapore, where they more than doubled to $8.9 billion. Chips and semiconductor-manufacturing equipment together accounted for about two-thirds of the overall increase in Singapore’s exports to China.
These figures cover only direct trade and exclude chips that may reach China through Hong Kong, which handled more than half of the mainland’s semiconductor imports in the first five months of 2026. Even so, the contrast reveals a changing pattern: China is supplying more chips to ASEAN factories, while Singapore is serving as a hub for semiconductors and chipmaking equipment entering the Chinese market.
UNCTAD’s investment analysis provides context for this pattern: ASEAN’s role is expanding mainly in assembly, testing, packaging, and related supplier activities—particularly in Malaysia and Vietnam—while leading-edge fabrication remains concentrated in a few advanced economies.
ASEAN’s Balancing Act Is Getting Harder
The chip trade distills a broader story told by these charts. Southeast Asia is becoming a critical production layer between Chinese industrial supply and global demand, especially for electronics and AI infrastructure. ASEAN economies have added manufacturing capacity and attracted substantial investment, but within networks in which Chinese inputs remain central and the United States and other external markets remain the primary destinations. The result is a deeper and more geographically dispersed form of integration.
That position brings gains and exposure at the same time. Export growth and technology investment coexist with widening trade deficits, pressure from Chinese overcapacity, and greater scrutiny over origin, content, and export controls. ASEAN governments are therefore not choosing between China and the United States so much as managing an economic model that depends on both. The central question is whether Southeast Asia can continue benefiting from its position at the intersection of these systems without becoming more vulnerable to each.