
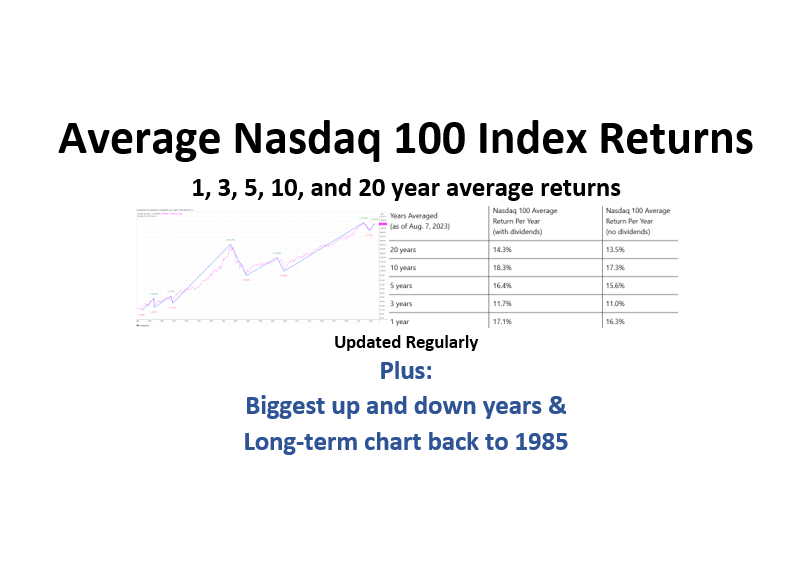
The Nasdaq 100 has a reputation for producing large returns over time, but with significant volatility. The Nasdaq 100 is considered a benchmark for technology stocks, as it includes the largest 100 non-financial stocks on the Nasdaq Stock Exchange. Approximately 65% of the index’s weight is in technology and telecommunications stocks.
The Nasdaq 100 index was launched in 1985. The Invesco QQQ Trust (QQQ), which tracks the Nasdaq 100 index, was launched in 1999.
In this article, you’ll see how the Nasdaq 100 has performed over the last 1, 3, 5, 10, 20, and 25 years.
Since 2002, the Nasdaq 100 has outperformed the S&P 500 returns by a significant margin.
Average returns can be deceiving because they hide the big up and down years that make up the average. Therefore, you’ll also learn what the biggest up and down years have been, in percentage terms.
Annualized Nasdaq 100 Returns Based on QQQ
Here are the annualized returns for the Nasdaq 100 index for the last 25, 20, 10, 5, 3, and 1 years. Statistics are based on the QQQ ETF, which has a 0.2% yearly expense ratio, so the actual index returns will be slightly higher (but you can’t invest in the index without incurring fees, so these are the returns you would have actually received).
| Time Period | Nasdaq 100 Annualized Return Per Year (with dividends) via QQQ |
| Since Inception (March 1999) | 10.73% |
| 25 Years | 13.05% |
| 20 years | 16.63% |
| 10 years | 20.57% |
| 5 years | 14.35% |
| 3 years | 25.93% |
| 1 year | 25.2% |
Returns have been calculated based on TradingView charts.
Since 1985 (41.6 years), the Nasdaq 100 has produced an annualized return of 14.01% (not including dividends).
Here is a video that breaks down the statistics, including how to calculate them on your own.
Everyone should passively invest some funds. Set it and forget it for 10 years or more to compound your wealth.
The Passive Stock Investing Using ETFs eBook lays out how to do it, including how to capitalize on the Nasdaq 100 returns.
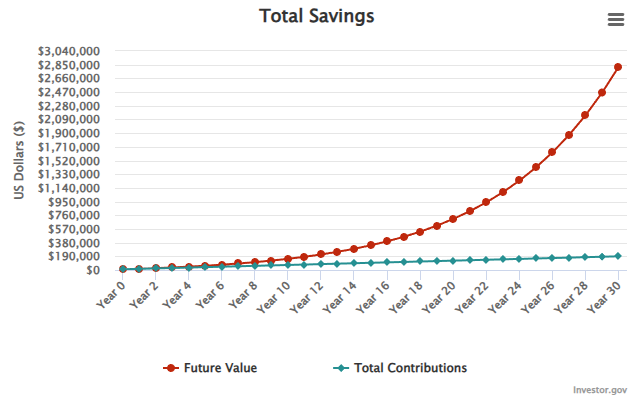
Making 13% per year, which the Nasdaq 100 has conservatively averaged over the last 20 years, produces a $2.2 million nest egg if investing $10K and adding an additional $500 each month for 30 years. Invest $190,000 total, over 30 years, to make $2.2 million. That’s the power of compounding.
That’s passively investing, not trading, and just adding a bit more to the position each month. You can use the investment calculator on Investor.gov to test out different scenarios. Note that returns may be higher or lower in the future.
The Biggest Up and Down Years for the Nasdaq 100
Many of the biggest up and down years occurred around the “tech bubble” of 2000, as well as the 2008 financial crisis and the recovery. All figures include dividend payments and are based on the QQQ ETF unless otherwise specified.
Biggest Nasdaq 100 Index Down Years
2008: -41.7%
2002: -37.4%
2000: -36.1%
2001: -33.3%
2022: -32.6%
Biggest Nasdaq 100 Index Up Years
Dates and returns prior to 2000 are based on the Nasdaq 100 index (and thus don’t include dividends) and not QQQ.
1999: +102%
1998: +85.3%
1991: +65%
2023: +56.42%
2009: +54.7%
2003: +49.7%
2020: +48.6%
1995: +42.5%
1996: +42.5%
2019: +39%
2013: +36.6%
2017: +32.7%
Trades that last a few weeks to a few months more your style? The Complete Method Stock Swing Trading Course shows you how to find explosive stocks that often rally 20% or more within a few weeks of entry.
Nasdaq 100 Returns by Year
The following are the Nasdaq 100 returns by year based on the QQQ ETF. Returns are calculated using the close of the prior year to the last day of the return year, including dividends.
2026: 14.97% (so far)
2025: 19.45%
2024: 25.72%
2023: 56.42%
2022: -32.6%
2021: 27.4%
2020: 48.6%
2019: 39%
2018: -0.1%
2017: 32.7%
2016: 7.1%
2015: 9.5%
2014: 19.2%
2013: 36.6%
2012: 18.1%
2011: 3.4%
2010: 20%
2009: 54.7%
2008: -41.7%
2007: 19%
2006: 7.1%
2005: 1.6%
2004: 10.5%
2003: 49.7%
2002: -37.4%
2001: -33.3%
2000: -36.1%
Nasdaq 100 Historical Chart with Rally and Decline Percentages
The Nasdaq 100 index began in 1985. The following chart shows the journey the index has taken since, including rallies and declines of more than 25% (peak-to-trough) over that period.
The chart is based on monthly data points. If using a shorter time frame, such as daily, there are many more 30% drops and rallies, but this chart shows the overall moves and their ultimate percentages.
The chart is logarithmic.

Nasdaq 100 ETFs
The easiest way to invest in the Nasdaq 100 is to use an exchange traded fund (ETF). You can buy and sell it like an individual stock, and the managers of the ETF make sure the fund tracks the index by buying the same stocks that are included in the Nasdaq 100.
Invesco QQQ Trust (QQQ) – a popular choice with huge daily volume and a 0.2% expense ratio per year.
Invesco Nasdaq 100 ETF (QQQM) – created for people more interested in buy-and-hold, as it has a lower expense ratio of 0.15%.
An expense ratio is the cost of managing the fund, or your cost of investing in it. So if the Nasdaq index returned 10% in a year, with a 0.2% expense ratio, your return as an investor would be 9.8%.
For Canadian investors looking to invest in the Nasdaq 100 via a Canadian ETF (that you buy in Canadian dollars), the Horizons Nasdaq-100 ETF (TSX: HXQ) is a solid choice. It provides direct exposure to both the Nasdaq 100 and the US dollar fluctuations vs the Canadian dollar.
The BMO Nasdaq 100 Equity Hedged to CAD Index ETF (TSX: ZQQ) hedges the US dollar exposure, so the return is theoretically similar to the Nasdaq 100 since currency fluctuations have less effect on the overall return.
Any time you buy a foreign asset in a different currency, the return you get is not only how the asset performed but also how the currency value has fluctuated over that time. Hedging reduces the effect of this currency-movement variable.
Cory Mitchell, CMT
Disclaimer: Nothing in this article is personal investment advice, or advice to buy or sell anything. Trading is risky and can result in substantial losses, even more than deposited if using leverage.