

One question, no simple answer
In every oil crisis, one question comes back again and again: what is the real price of oil right now?
It sounds like it should have a neat answer: one barrel, one price, one number. But that is not how the oil market works, especially not in a crisis. The correct answer depends on what crude is being sold, where it is being sold, when it is being delivered, and whether the buyer is purchasing a real barrel for immediate refining or a financial contract for future delivery.
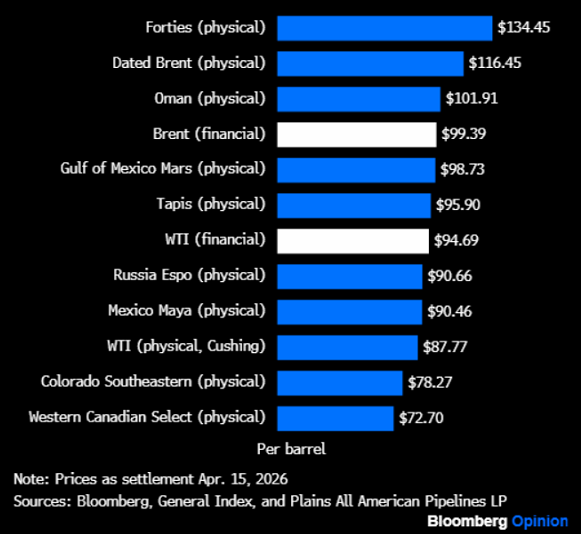
That is why, in the current market, one barrel can still be bought in parts of inland North America for less than $80, while elsewhere the effective delivered cost can be dramatically higher once logistics and scarcity are properly included.
The market is split between physical barrels and paper barrels
To understand the current distortion, the first distinction that matters is the one between the physical market and the financial market.
The physical market is where actual crude changes hands. These are the barrels that refiners must secure, move, insure and process. This market reflects immediate supply-and-demand conditions and is heavily shaped by logistics, shipping access, storage availability and regional bottlenecks.
The financial market is different. That is where futures, swaps and options trade, what oil traders call paper barrels. These contracts do not necessarily represent immediate physical movement. Their role is to transfer price risk and express views about future supply, demand and disruption.
The two markets are linked, of course, but they do not perform the same function. One is about real barrels today. The other is about risk and expectations further out on the curve.
Why the two prices can diverge so sharply
In calmer periods, physical and financial prices tend to move closely together. The answer to the “real price” question is then relatively easy: look at Brent, WTI or Dubai, and you will be broadly right.
But these are not calm conditions.
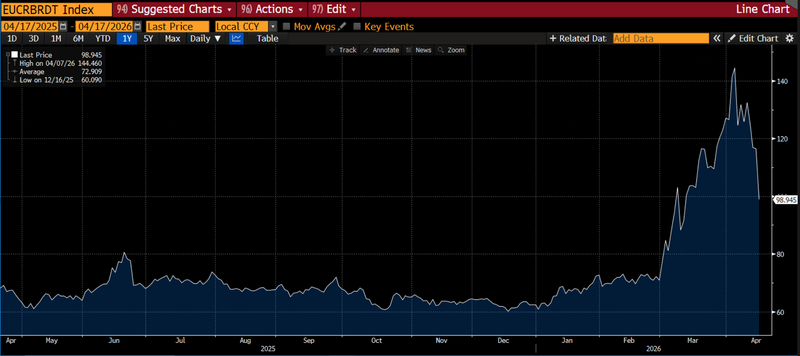
The current Gulf crisis has badly disrupted shipping through Hormuz, pushed freight rates sharply higher, lifted insurance costs and made refiners scramble for immediately available cargoes. That has driven physical premiums far above the financial benchmarks that most people see quoted on screens.
Saudi Arabia’s official selling prices make the point vividly. Saudi Aramco is charging European customers a record premium for Arab Light over Brent, reflecting how tight the physical market has become. What once traded at a small premium or discount can now command double-digit additions above the benchmark.
And that is before freight and insurance are included.
The real delivered barrel is far more expensive than the headline quote
This is where many simplified readings of the oil market go wrong. A Brent futures price near $100 a barrel does not mean every buyer can access crude at anything close to that level.
For many refiners, especially those far from the cheapest producing basins, the real cost is the barrel plus transport plus insurance plus war-related disruption costs. Freight that once cost around $1 a barrel can now reach $25. Insurance is no longer a rounding error. In some cases, the delivered cost matters far more than the futures benchmark itself.
This is why the physical market is telling a much more stressed story than the financial market.
The paper market is already looking beyond the immediate shock
That does not mean the financial market is broken. It simply means it is looking at a different horizon.
Paper barrels price expected future outcomes. Traders in those markets are asking what oil might look like in a few months, not what refiners must pay today. If the conflict eases, if Hormuz partially reopens, if diverted cargoes normalize, and if emergency adjustments reduce the supply squeeze, then prices later in the year could look materially lower than they do in the current physical scramble.
So the paper market is not denying today’s shortage. It is pricing the possibility that the shortage eases before long.
That difference in timing is critical. The physical market is mostly about now through the next 30 days. The financial market often stretches from two months out to many years ahead.
Physical scarcity is severe right now
The message from the physical market is straightforward: available barrels are tight, and buyers who need them immediately are paying up.
Refiners cannot operate on theory. They must secure feedstock, even if it means paying far above the screen price. For many of them, especially state-backed or strategically important refiners, the cost of overpaying is still preferable to the cost of not having crude at all. In a serious supply shock, paying too much is painful. Not having the barrel can be existential.
That is one reason physical prices have surged so dramatically in some regions even as the futures market has shown signs of calming.
Geography is now one of the biggest price drivers
Where a refiner sits matters enormously.
The shock began east of Suez, and that is where both physical prices and shipping dislocation have been most severe. Asian refiners, and to a lesser extent some European buyers, are facing a much harsher cost structure than US refiners because they must compete for scarcer cargoes and pay sharply higher transport costs.
North America, by contrast, remains the cheapest basin in the world. Thanks to the shale revolution, deep domestic production and large pipeline systems, many US refiners still access crude at remarkably low prices compared with buyers in Asia and Europe. Physical grades in Colorado, Nebraska, Utah and parts of Canada are trading far below the prices seen in seaborne markets.
Source: Bloomberg
That is not a small detail. It is one of the clearest demonstrations of the geopolitical and economic significance of the US shale boom and Canadian oil sands. In the middle of a historic external supply shock, North America is still long oil.
But North America’s cheap advantage may not last forever
Even that gap may not remain as wide if the shock persists.
An armada of tankers is heading toward the US coast because American crude is now one of the most attractive barrels available to the rest of the world. If Hormuz stays impaired, more overseas buyers will turn to US exports, especially grades that are easier to move internationally.
That process has already begun. Mars crude from the Gulf of Mexico is becoming more valuable because it is one of the more exportable US grades. As foreign demand rises, North American prices are likely to climb, while some of the extreme regional divergence elsewhere may begin to narrow.
In other words, if the disruption continues, the US becomes the barrel of last resort.
Nominal prices and real prices are not the same thing
There is also another layer to the question: should oil be judged in nominal terms or inflation-adjusted terms?
Nominally, some physical prices are already at extreme levels. But in real terms, adjusted for inflation, they still have room before matching the full intensity of earlier crises. The Brent peaks seen in 2008 would be equivalent to something above $200 a barrel in today’s money.
That does not make the current shock mild. It simply means comparisons with past crises require context.
Consumers care even more about products than crude
And then there is the question of whether crude itself is even the most important price to watch.
Consumers do not buy crude oil. They buy gasoline, diesel and jet fuel. In acute shocks, refined products often rise faster than the crude they are made from, because refining capacity, distribution systems and end-market panic can amplify the squeeze. Politically and economically, that may matter more than the benchmark crude price itself.
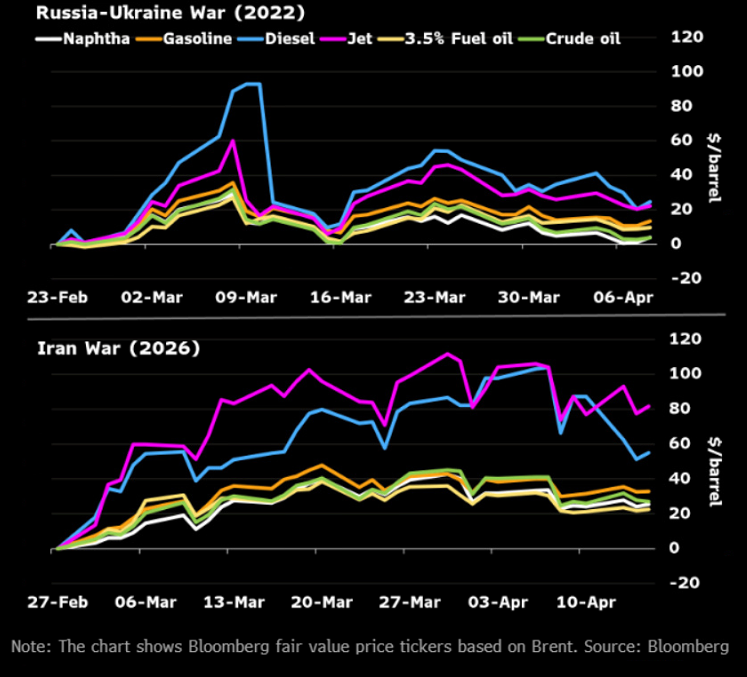
Source: Bloomberg
So when asking for the real oil price, one could reasonably argue that the more relevant number for many economies is not the crude benchmark but the final fuel price faced by households, airlines, truckers and industry.
So what is the real price?
If forced to answer, the best answer is not one of the cheapest inland US grades, and not one of the most extreme distressed delivered prices either. The most honest answer is that the real oil price is a spectrum.
But if one had to choose a representative number for this week’s physical market across major regions, it would likely be well above the main futures quotes and closer to the low-to-mid $100s once immediate scarcity and logistics are properly reflected.
The deeper point, though, is not the exact number. It is that the oil market is currently sending two messages at once.
Source: Bloomberg
- The physical market says barrels are extremely tight today.
- The financial market says the shortage may ease in the months ahead.
Both can be true. And in a crisis like this, understanding that gap is much more useful than pretending oil has one single, clean, universal price.