

Rexford Industrial Realty (NYSE:REXR) presented its first-quarter 2026 results on April 24, raising full-year guidance despite facing market headwinds, with strategic share repurchases and record leasing activity offsetting operational pressures in Southern California’s industrial real estate market.
The company reported quarterly Core FFO per share of $0.61, representing a 1.6% decline year-over-year but beating internal forecasts by $0.01. More significantly, Rexford exceeded analyst expectations with earnings per share of $0.38—a 40.74% surprise over the $0.27 forecast—while revenue reached $245.08 million versus the anticipated $242.45 million. The stock responded positively, rising 3.88% in premarket trading to $37.74.
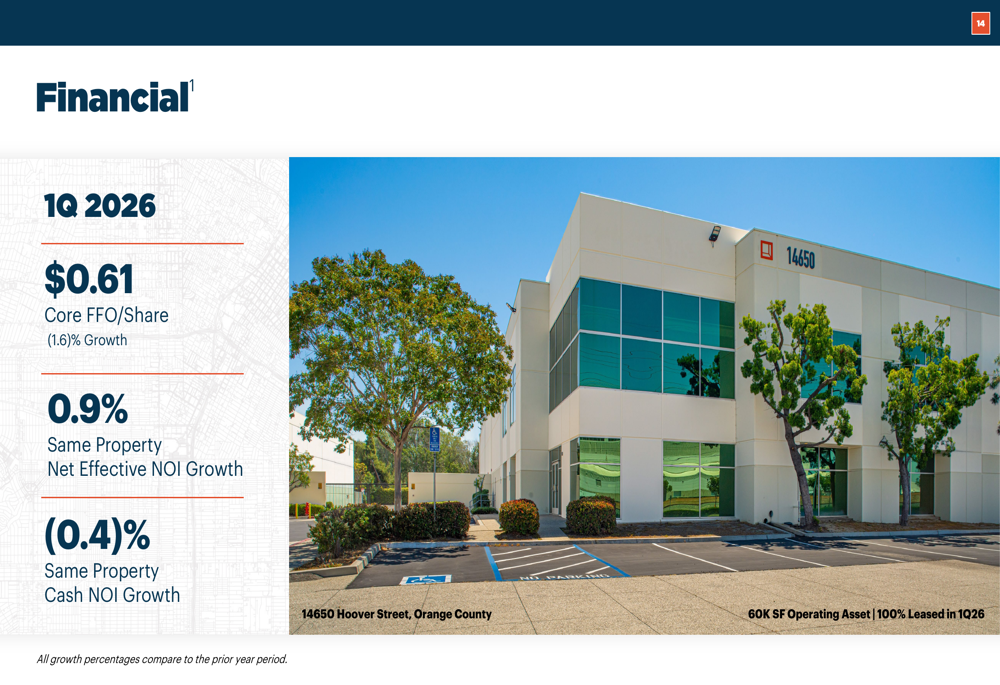
Financial Performance Highlights
The company’s Q1 2026 performance reflected a mixed operational environment. Same property net effective NOI grew 0.9% year-over-year, while cash NOI declined 0.4%, indicating the impact of lease concessions and market rent compression. However, operational metrics showed meaningful improvement, with average same property occupancy reaching 96.3%—a 160 basis point increase compared to Q1 2025.
As shown in the following quarterly performance summary, Rexford’s key financial metrics demonstrated both strengths and challenges:
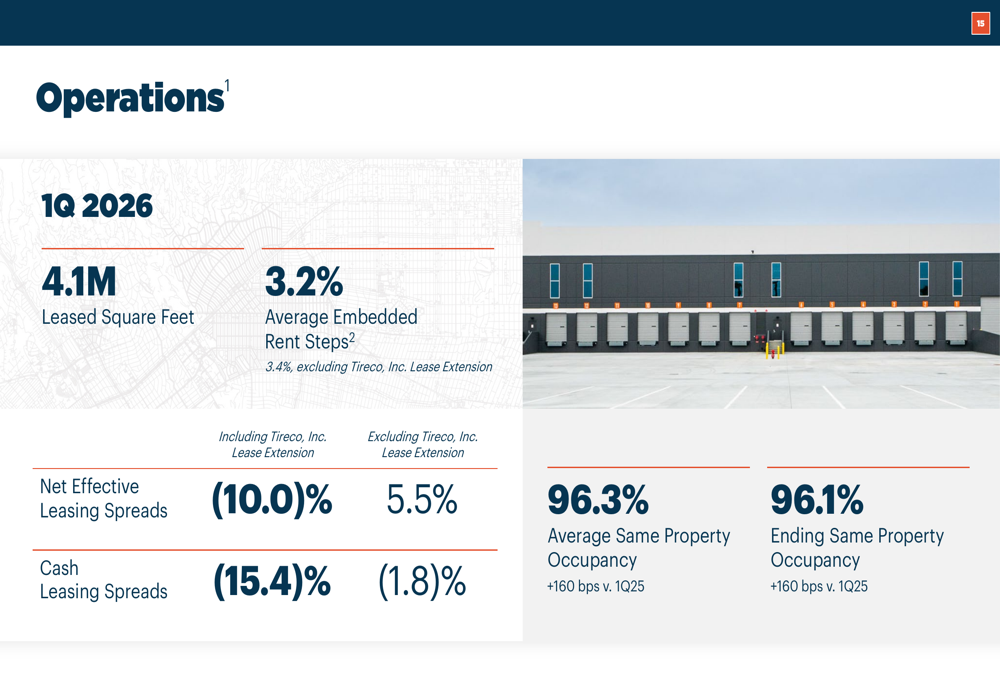
The company’s leasing momentum proved particularly strong, with 4.1 million square feet of leases executed during the quarter—representing a 70% increase compared to the same period last year. This record activity occurred despite net effective leasing spreads of negative 10.0%, though excluding a significant lease extension with Tireco, Inc., spreads would have been positive 5.5%.
Rexford’s operational performance is detailed in the following metrics:
Strategic Capital Recycling Initiative
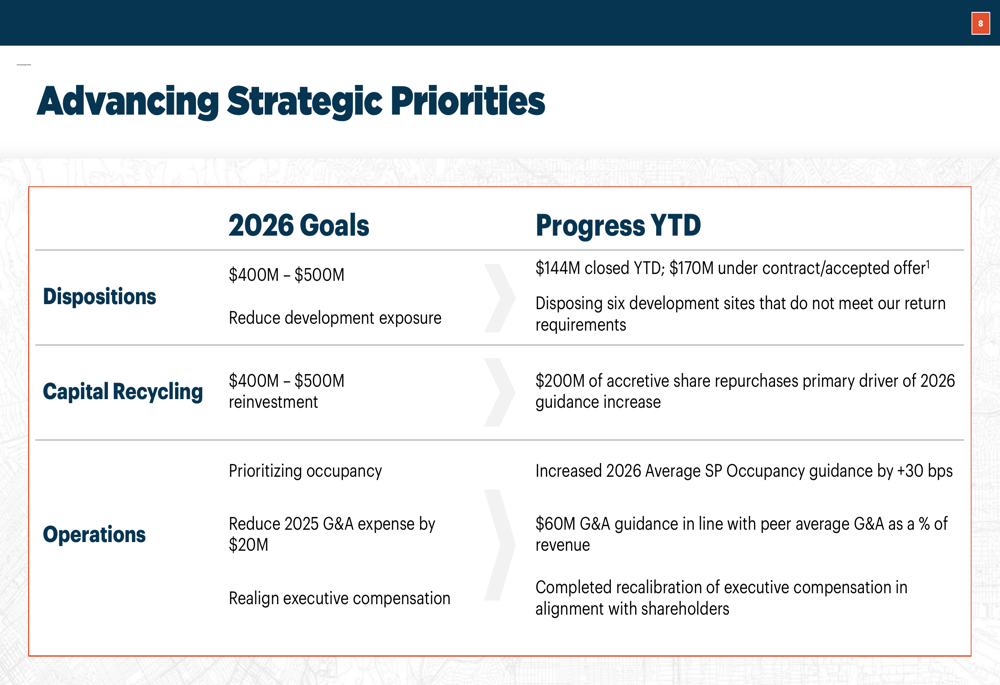
The centerpiece of Rexford’s updated guidance centers on an aggressive capital recycling strategy. The company executed $200 million in share repurchases during the quarter at an average price of $36 per share, which management identified as the primary driver of the 2-cent guidance increase at the midpoint.
Year-to-date, Rexford closed $144 million in property dispositions across six assets totaling 435,000 square feet, with an additional $170 million under contract or accepted offer. Notably, the company is disposing of six development sites that no longer meet its return requirements, reflecting a more disciplined approach to capital allocation.
The company’s progress against its strategic priorities is illustrated below:
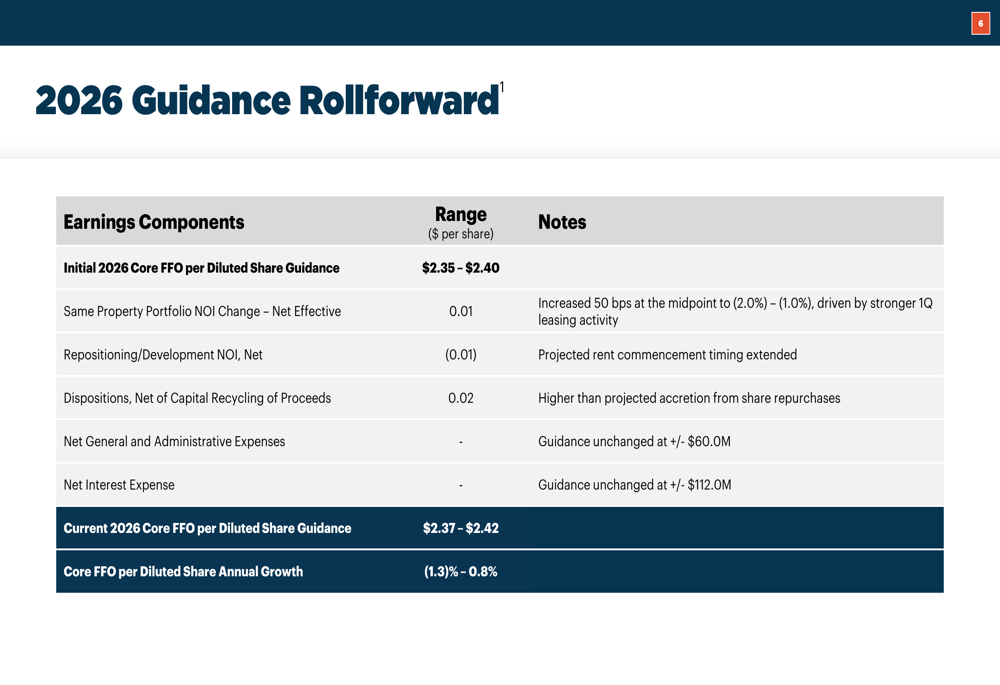
Updated 2026 Guidance
Rexford raised its full-year 2026 Core FFO per share guidance to $2.37-$2.42, up from the initial range of $2.35-$2.40. The guidance improvement reflects three key factors: a 1-cent contribution from improved same property NOI performance driven by stronger leasing, a 2-cent benefit from accretive share repurchases net of dispositions, and a 1-cent headwind from extended rent commencement timing on repositioning and development projects.
The detailed guidance comparison shows improvements across multiple operational metrics:
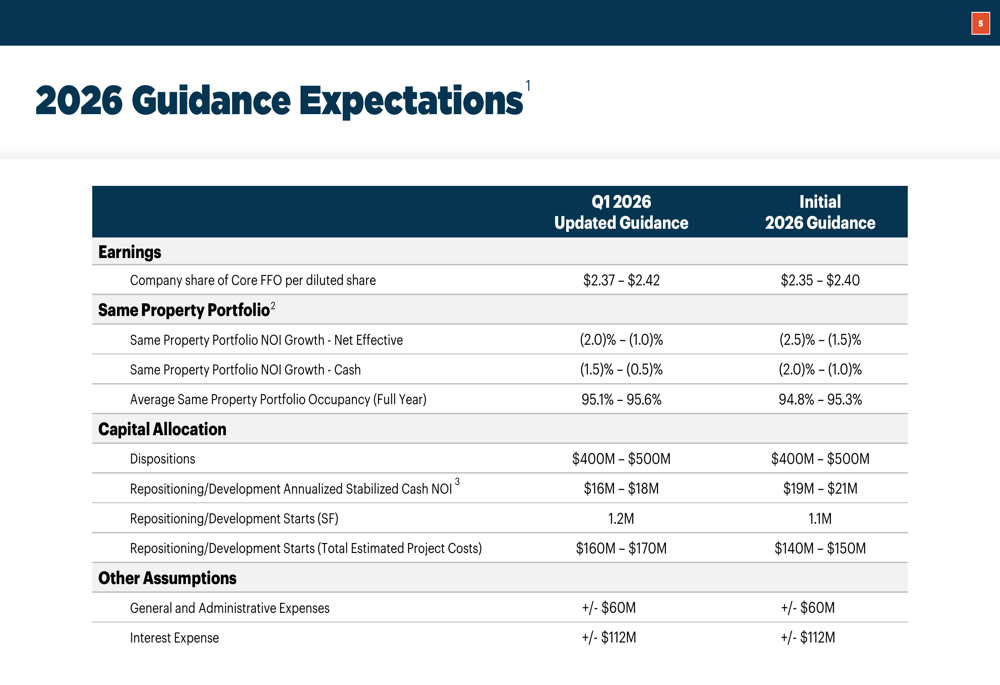
Same property NOI growth guidance improved by 50 basis points at the midpoint to a range of negative 2.0% to negative 1.0% on a net effective basis, while average same property occupancy guidance increased by 30 basis points to 95.1%-95.6%. The company maintained its disposition target of $400-$500 million for the full year.
The specific drivers of the guidance revision are broken down as follows:
Competitive Market Position
Rexford’s presentation emphasized its strategic advantage in Southern California’s supply-constrained industrial market. Overall supply under construction in infill SoCal stands at just 1.2% of total stock—near historic lows—while supply for properties under 100,000 square feet, which represents Rexford’s core focus, sits at only 0.5%.
The favorable supply dynamics supporting Rexford’s long-term positioning are illustrated in the following charts:
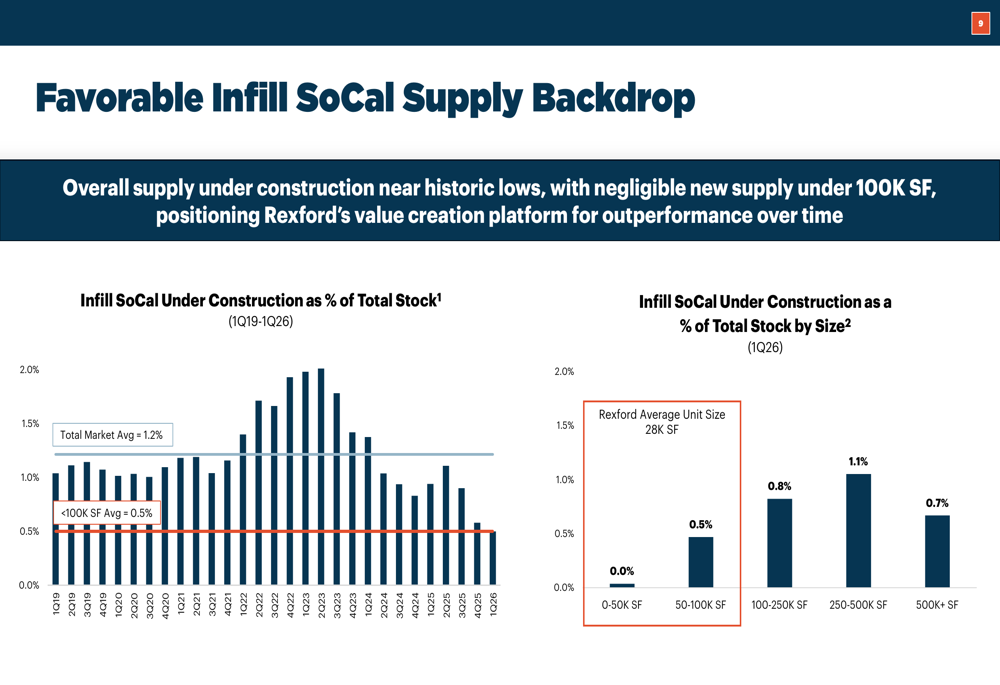
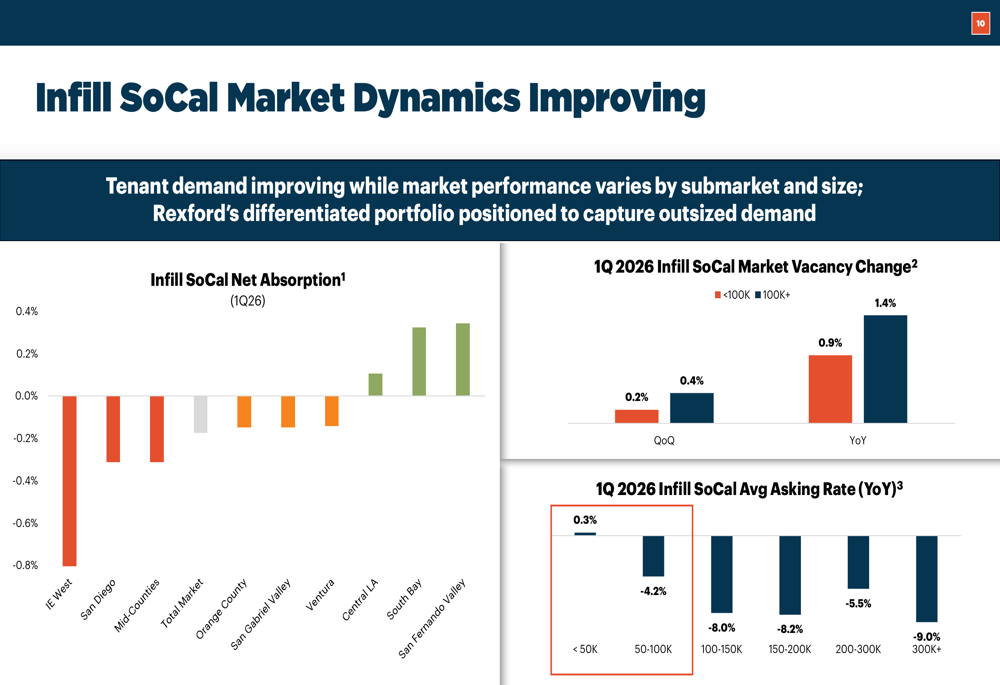
This supply constraint is particularly pronounced in Rexford’s wheelhouse. With an average unit size of 28,000 square feet, the company operates in a segment experiencing essentially zero new supply. Properties under 50,000 square feet showed positive asking rate growth of 0.3% year-over-year in Q1 2026, contrasting sharply with declines of 4.2% to 9.0% for larger properties.
Market dynamics by submarket and property size demonstrate improving tenant demand in specific segments:
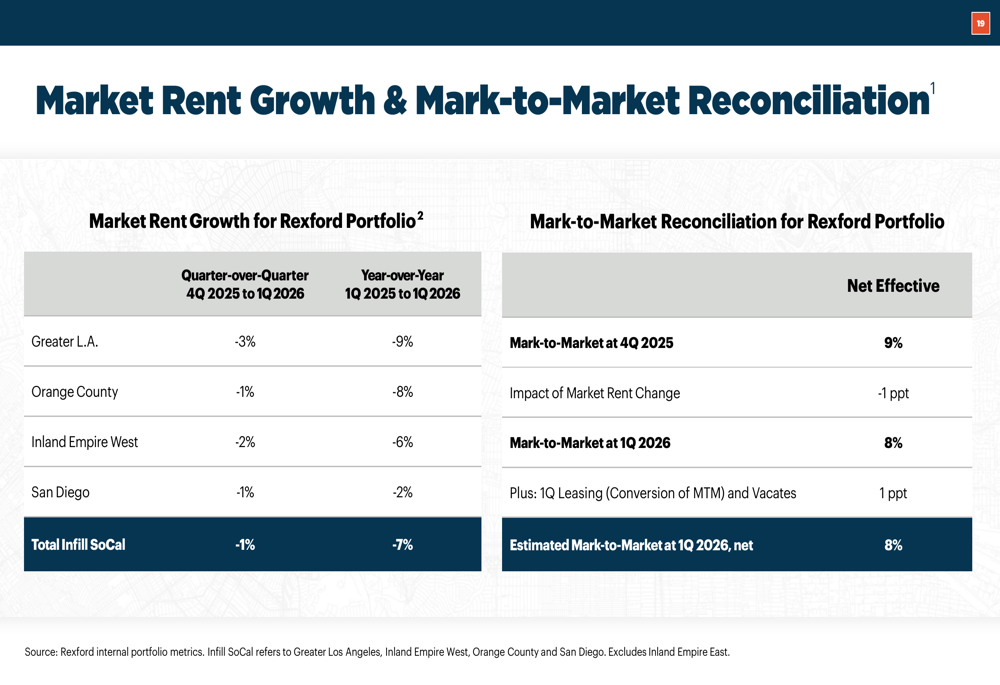
Despite overall market rent declines of 7% year-over-year across infill Southern California, Rexford maintains an 8% mark-to-market spread on its portfolio, providing embedded growth potential as leases roll.
The company’s detailed market rent analysis and mark-to-market reconciliation shows:
Operational Efficiency and Governance Improvements
Alongside its capital allocation strategy, Rexford highlighted significant progress in operational efficiency. The company projects 2026 general and administrative expenses as a percentage of revenue will reach 6.1%—below the peer average of 6.3% and down from 11.1% in 2020.
The company’s G&A improvement trajectory and executive compensation realignment are detailed below:
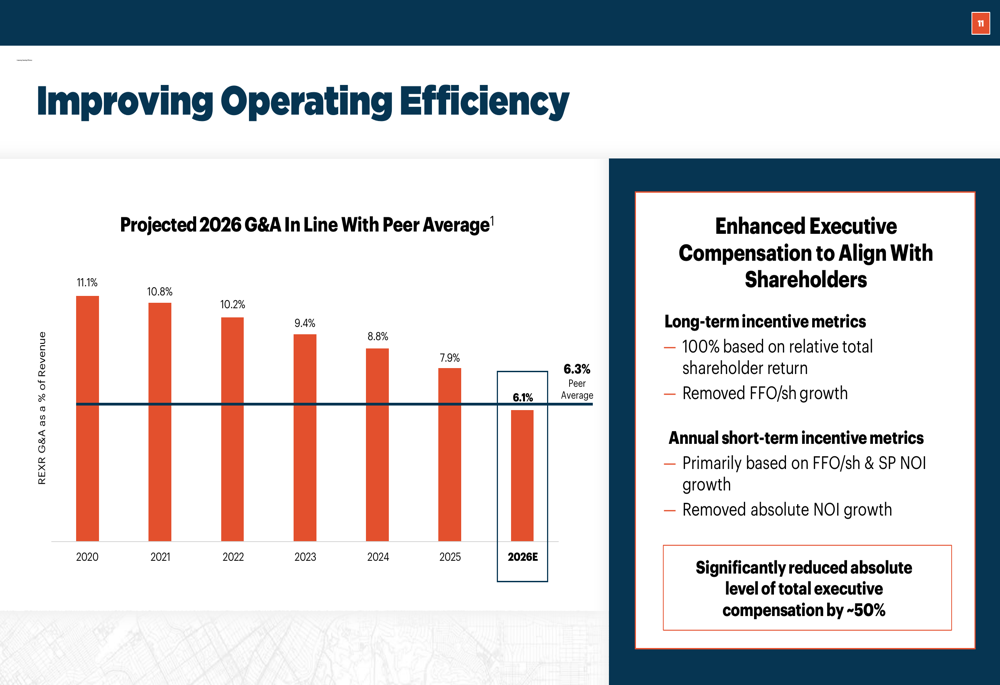
Management also completed a comprehensive realignment of executive compensation, shifting long-term incentive metrics to 100% relative total shareholder return (removing FFO per share growth) and reducing the absolute level of total executive compensation by approximately 50%. CEO Howard Schwimmer noted this change reflects a commitment to “alignment with shareholders” during the earnings call.
Balance Sheet and Liquidity
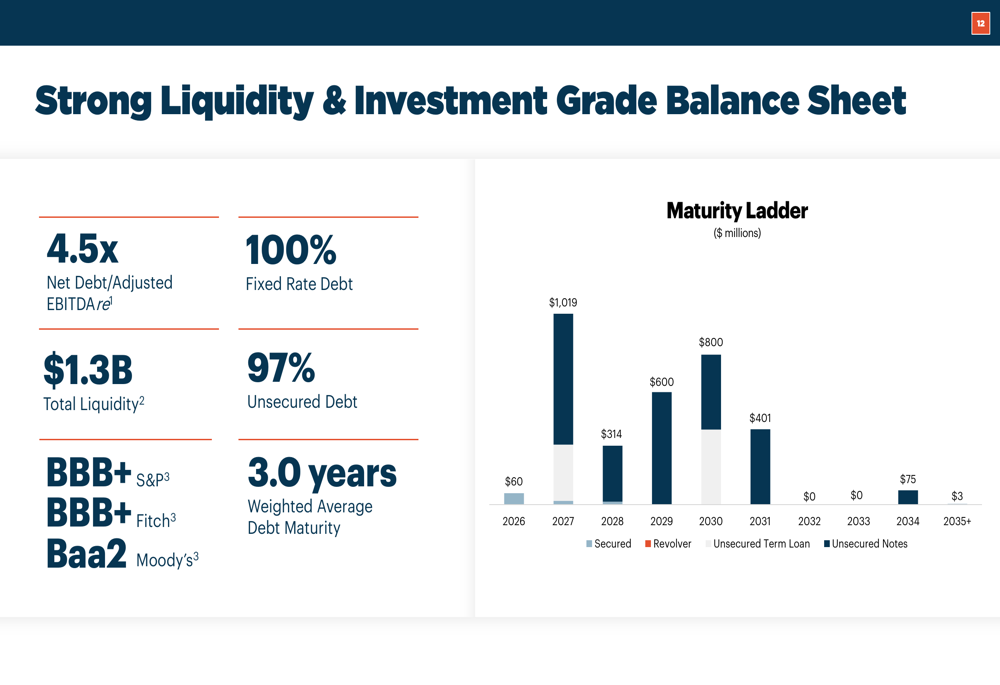
Rexford maintained its investment-grade balance sheet with a Net Debt to Adjusted EBITDAre ratio of 4.5x and total liquidity of $1.3 billion, comprising approximately $52 million in cash and nearly full availability on its $1.25 billion revolver. The company’s debt structure is 100% fixed-rate and 97% unsecured, with a weighted average maturity of 3.0 years.
The company’s comprehensive overview of key metrics and balance sheet strength:

The debt maturity profile shows manageable near-term obligations, with the company’s liquidity position and maturity ladder presented below:
Risks and Market Headwinds
Despite the positive guidance revision, Rexford faces several challenges. Market rent declines of 7% year-over-year continue to pressure releasing spreads, and the company acknowledged potential for increased bad debt expenses concentrated among a few tenants. The negative same property NOI growth guidance—even with the 50 basis point improvement—indicates ongoing operational headwinds.
CFO Laura Clark emphasized during the earnings call that “the raised guidance reflects our commitment to delivering shareholder value through disciplined financial management,” suggesting the company is navigating a challenging operating environment through strategic financial engineering rather than robust fundamental improvement.
The company’s forward-looking statements caution that actual results may vary materially from projections due to risks affecting the real estate industry, credit market disruptions, potential loss of key personnel, and changes in tax and environmental laws.
Outlook
With its updated guidance implying Core FFO per share annual growth of negative 1.3% to positive 0.8%, Rexford is positioning itself for a potential inflection point. The company plans to continue its share repurchase program, targeting $400-$500 million in total capital recycling for 2026, with approximately $300 million in additional disposition proceeds expected by year-end.
The combination of record leasing activity, occupancy gains of 160 basis points year-over-year, and historically low supply in its core small-bay industrial segment suggests Rexford may be well-positioned for improved performance as market conditions stabilize. However, the company’s near-term performance will likely depend more on its ability to execute accretive share repurchases than on operational momentum, given the ongoing market rent headwinds across Southern California’s industrial real estate sector.
Full presentation:
This article was generated with the support of AI and reviewed by an editor. For more information see our T&C.