

Bitcoin (BTC) has entered a new bull market after reclaiming its 365-day moving average at $80,500 and climbing above $86,000, according to a CryptoQuant report on Tuesday.
Bitcoin reclaims 365-day MA, confirms new bull market trend
The move marks the first time Bitcoin has reclaimed its 365-day moving average since March 2023.
“Historically, Bitcoin’s bull markets have “officially” begun when price closes above its 365-day moving average, and bear markets when it falls below,” CryptoQuant wrote.
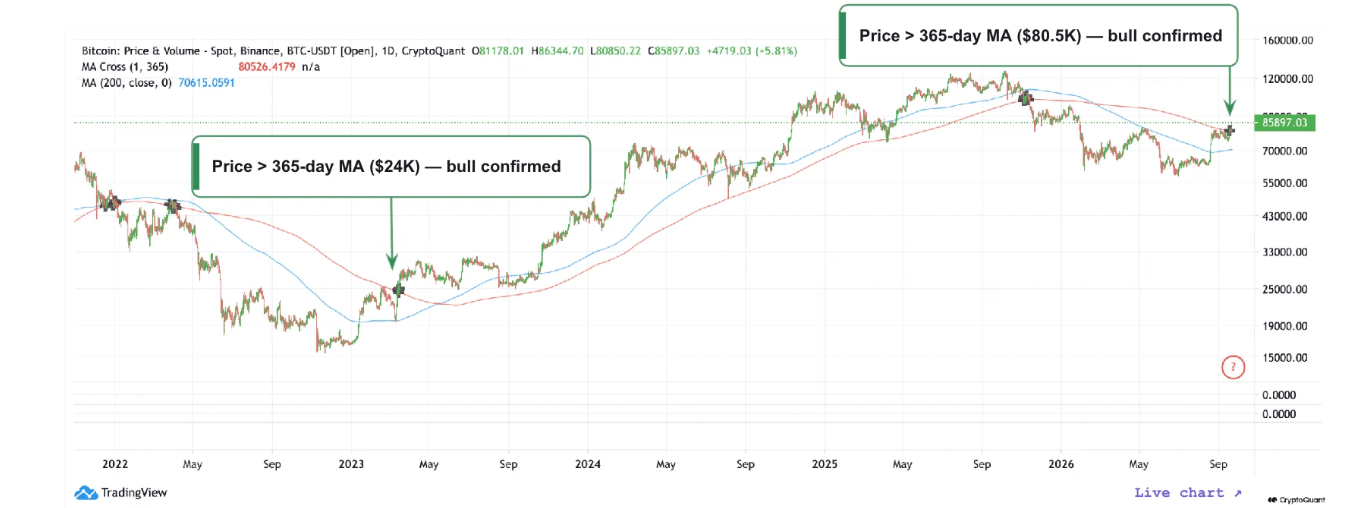
The firm noted that the 200-day moving average, currently around $70,600, remains a key support level below current prices.
Supporting the trend, CryptoQuant’s Bull Score has remained in bullish territory since mid-August and currently stands at 80. The indicator rose above 60 after Bitcoin’s summer bear phase, signaling a shift toward more favorable market conditions. Readings of 60 or higher have historically coincided with sustainable bull markets, indicating that “onchain valuation turned bullish before price confirmed it.”
Bitcoin cycle indicator moves into bull phase
CryptoQuant’s Bull-Bear Market Cycle Indicator has also shifted from bearish conditions into a bull phase.
The indicator spent most of 2026 in the bear phase before moving into the “Early Bull” phase in mid-August. It has since advanced into the “Bull” phase and remained there for most of the previous month.
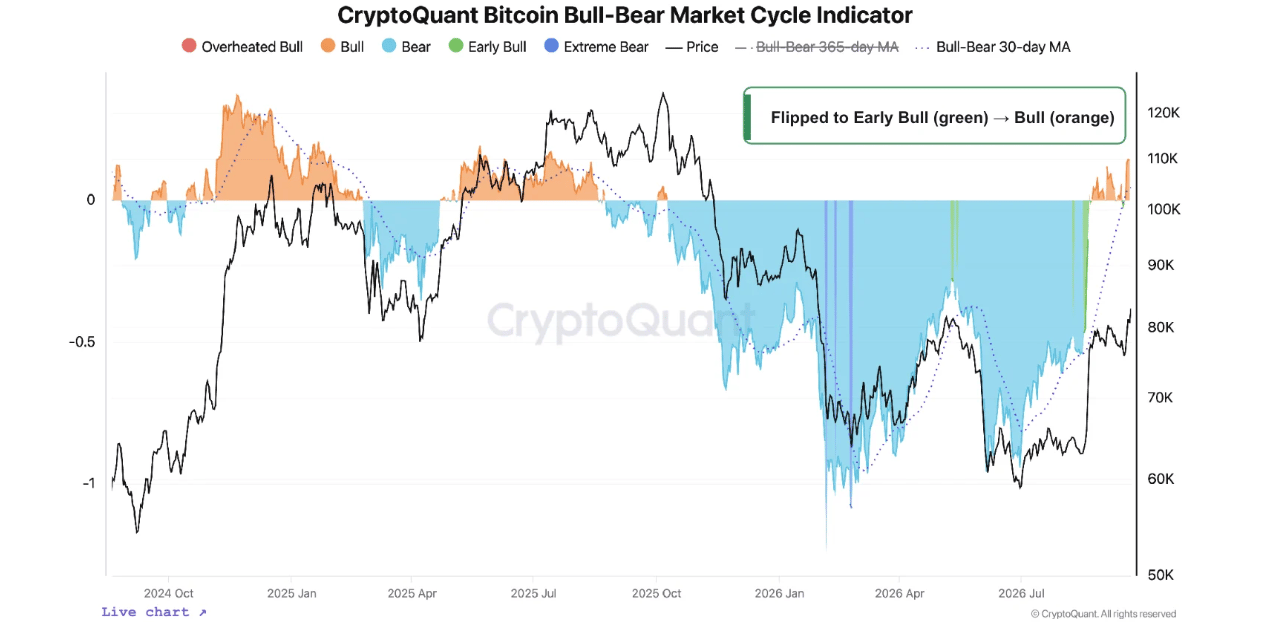
The report said the indicator, along with the Bull Score and 365-day moving average, now provides multiple signals pointing to the same market direction.
“When the Bull Score, the cycle indicator and the 365-day MA all point the same way, the confirmation is far stronger than any single signal alone,” CryptoQuant added.
Bitcoin has also moved through a supply zone between $76,000 and $81,000. This level represented a major supply area with concentration from long-term holders (LTH) and seven-year-old “OG” tokens earlier this year.
With Bitcoin now trading above $86,000, that supply zone has been cleared and is no longer the top crypto’s main overhead resistance. CryptoQuant noted that the next significant supply cluster is located around $88,000 to $91,000, where onchain supply aligns with the upper band of the trader’s realized price.
Bitcoin’s trader realized price currently stands at roughly $64,300, while its upper band is around $90,000. CryptoQuant noted that approaching this upper band can stretch trader profit margins and increase selling pressure.
“Historically, as price approaches the upper band, trader profit margins stretch and selling can intensify – a natural pause point within an uptrend, not a reversal,” CryptoQuant stated.
Altcoin holders remain underwater despite ‘alt season’ momentum
With Bitcoin showing signs of a return to a bull market, altcoins remain largely underwater, with most holders still sitting on unrealized losses, according to Glassnode.
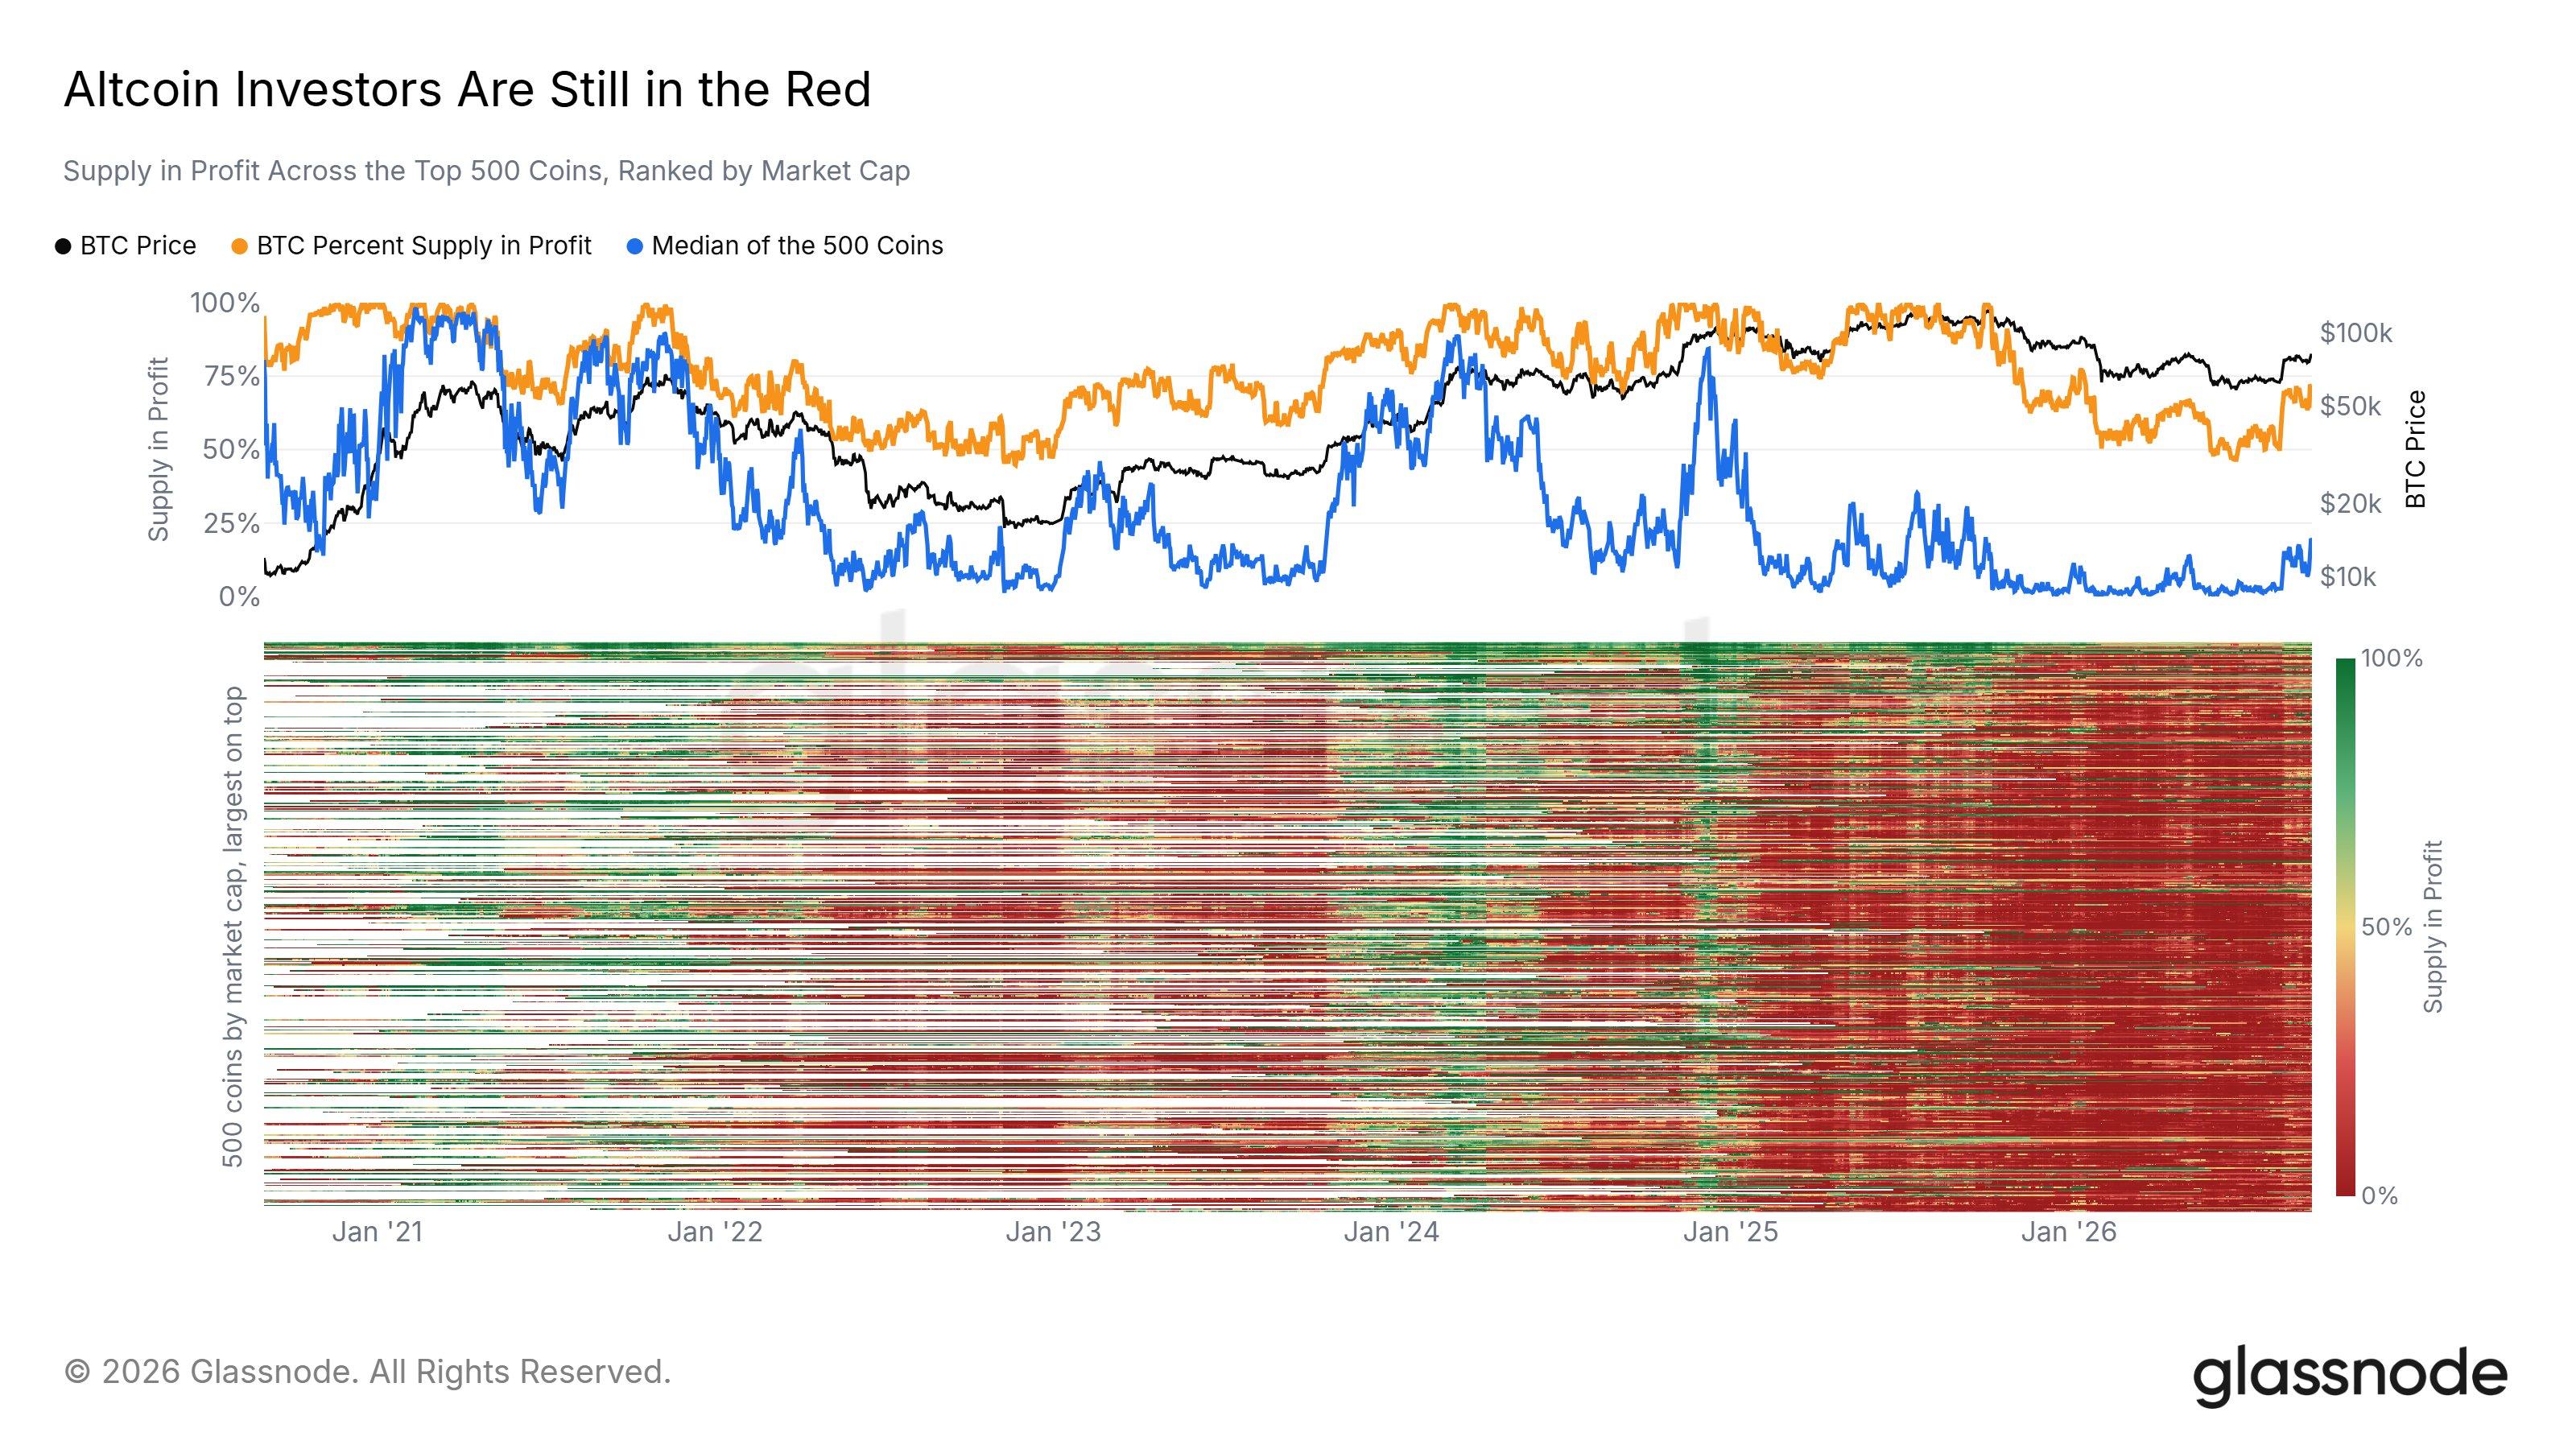
The firm wrote in an X post on Tuesday that the median altcoin has less than a quarter of its circulating supply in profit.
“Global market tops tend to occur once a majority of supply across the entire market is deep in profit. That point is still a long way off,” Glassnode wrote.
However, the firm previously identified a shift in altcoin momentum, stating that its altcoin cycle signal had flipped from Bitcoin to an “altcoin season.” Glassnode highlighted that altcoins remained flat during Bitcoin’s August rally, while BTC captured most of the market’s momentum. The latest rally, however, has been broader, with altcoins participating more significantly.
Bitcoin is trading at $86,300, down 0.5% in the past 24 hours at the time of writing.