

Bitcoin price traded near $61,700 on July 3, according to crypto.news price data, after recovering from the sub-$60,000 area.
The move came as U.S. spot Bitcoin ETFs returned to net inflows for the first time since June 16.
U.S.-listed spot Bitcoin ETFs recorded $221.7 million in net inflows on July 2, according to SoSoValue data. Fidelity’s FBTC led with about $166 million in inflows, while Ark Invest and 21Shares’ ARKB added $91.8 million. VanEck’s HODL saw $4.4 million in inflows.
The rebound ended a 10-day negative streak that removed more than $2.7 billion from the products. June was also the weakest month for U.S. spot Bitcoin ETFs since their 2024 launch, with about $4.5 billion in total net outflows.
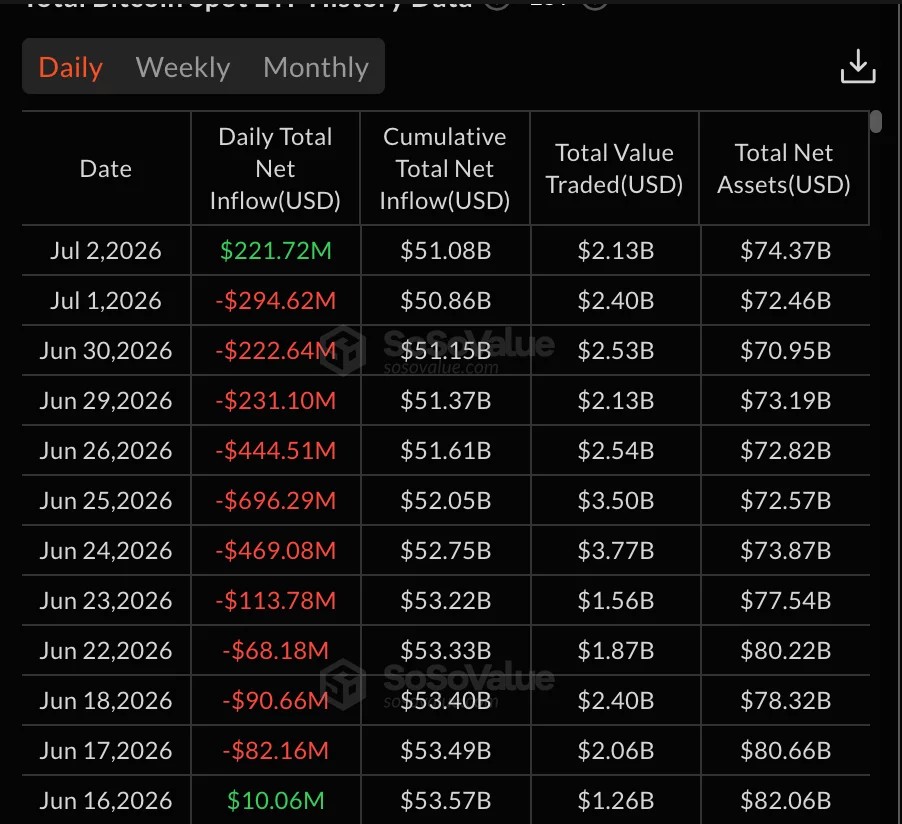
Bitcoin fell below $59,000 afterJune ETF outflows hit a record $4.5 billion. That selling wave kept pressure on $BTC and raised doubts over whether the $60,000 region could hold.
Bitcoin faces $62,800 and $65,000 tests
The crypto has improved, but the chart has not confirmed a clean bullish reversal. $BTC is trading slightly below the Bollinger middle band near $62,296. The upper band sits near $66,844, while the lower band is around $57,748.
This means the token has moved away from the lower end of the range, but it has not regained full control. A daily move above the middle band would strengthen the short-term setup and show that buyers are taking back momentum.
Market analyst Ted said Bitcoin is close to the $62,000 level and needs to reclaim $62,800 and $65,000 for a stronger rally this month. Those levels match earlier resistance zones watched by traders after the June selloff.
$BTC is almost at the $62,000 level.
The 2 key levels for Bitcoin are $62,800 and $65,000, which should be reclaimed for a decent rally this month. pic.twitter.com/TbkiuAss7l
— Ted (@TedPillows) July 3, 2026
Previously, $BTC needed to reclaim the$62,800 to $65,000 range to show that buyers were gaining short-term control. That area remains the key technical barrier.
Momentum improves, but not fully
The Awesome Oscillator remains negative near -3,085.64, showing that broader momentum is still weak. However, recent green histogram bars show that bearish pressure is easing compared with deeper negative readings from June.
That setup points to stabilization rather than full recovery. $BTC needs the Awesome Oscillator to move closer to zero or above it before traders can call stronger bullish momentum.
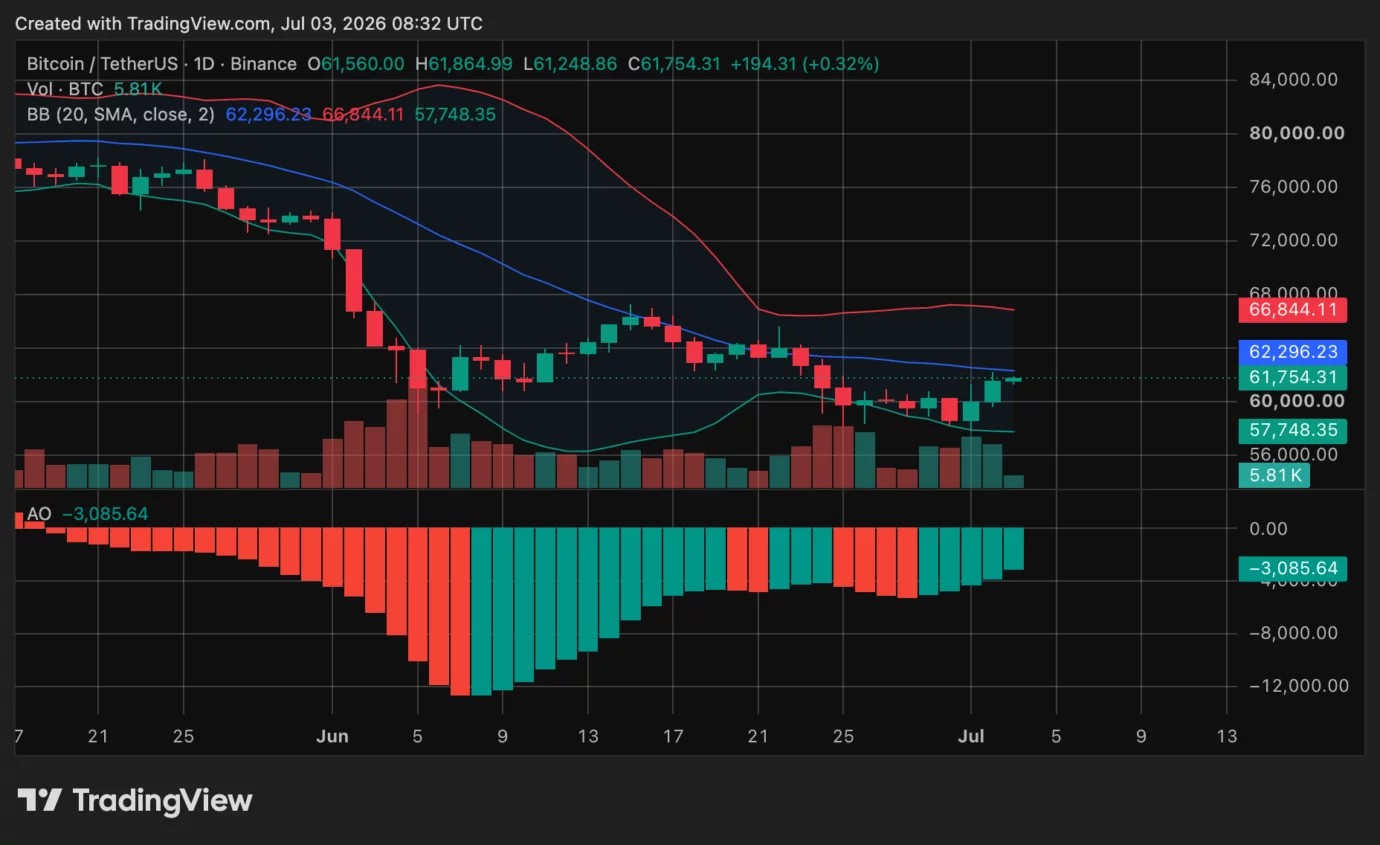
The Bollinger Bands also remain wide after June’s decline, showing that volatility is still high. Price holding above the lower band is constructive, but the current position below the middle band shows that the market is still in repair mode.
As previously reported, Bitcoin’s earlier move above $60,000 lacked fresh buying fuel because stablecoin growth and spot demand remained weak. The latest ETF inflow helps that case, but one positive day is not enough to confirm a sustained trend.
On-chain data points to accumulation
Crypto analyst Ali Charts said Bitcoin’s Investor Price sits near $48,300. He described that level as a long-term cost-basis zone that has marked major cycle bottoms in past bear markets. If $BTC drops toward that area, he said it may offer a high-conviction accumulation signal for long-term buyers.
BUY BITCOIN AT $48,300
This level is defined by the Bitcoin Investor Price, one of the most accurate models for tracking the market’s true cost basis.
The Investor Price tracks the average acquisition price of all economically circulating Bitcoin. By dividing the Investor Cap… pic.twitter.com/0RLJAecMx5
— Ali Charts (@alicharts) July 2, 2026
Ali Charts also said wallet behavior has shifted over the past 30 days. Retail wallets, mid-sized holders, and large entities holding between 1,000 and 100,000 $BTC have moved back toward net buying. He said this coordinated demand can help create a stronger price floor.
CryptoQuant analyst CryptoZeno gave a similar on-chain view. The analyst said Bitcoin’s adjusted sell-side risk ratio has entered a historical accumulation zone. Low readings often show that realized profits and losses are small compared with market value, meaning investors are less willing to sell at current prices.
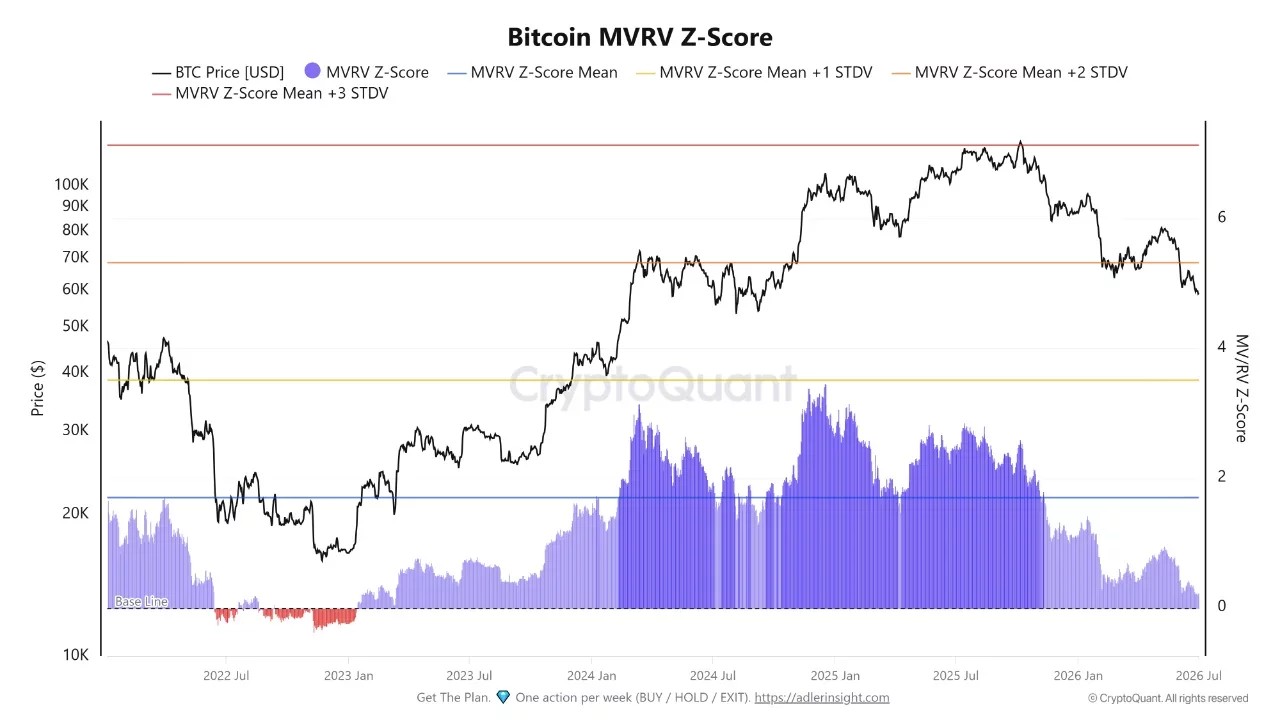
The same analyst also said Bitcoin’s MVRV Z-Score has fallen below the +2 standard deviation level. That suggests the valuation premium is cooling, but it does not yet show deep undervaluation or a classic cycle-top structure.
ETF rebound does not remove risk
The return of ETF inflows gives the crypto its strongest short-term support in weeks. It also helps explain the move back toward $62,000 after June’s heavy outflows weakened institutional demand.
Still, traders will need more than one day of ETF buying. If inflows continue, $BTC could challenge $62,800 first, then $65,000. A clean break above $65,000 would improve the recovery case and may open the way toward the upper Bollinger band near $66,800.
If $BTC fails to reclaim $62,800, the rebound may remain a relief move. A drop below $60,000 would put $57,700 and $55,000 back in focus, especially if ETF flows turn negative again.