

Key Takeaways
- Ethereum is down 30% YTD, falling from $3,001 on January 1 to $2,113 at press time, making it one of the worst-performing major crypto assets of 2026.
- The ETH/BTC ratio has dropped to 0.027583, its lowest level since July 2025, while Blockchain Center’s Altcoin Season Index shows only 29% of the top 50 alts outperforming BTC over the past 90 days — well below the 75% threshold for altcoin season.
- Institutional pressure is compounding the weakness; spot ETH ETFs bled $404M across two consecutive weeks, and short-term holders have offloaded 14% of their coins since April 26.
Leading altcoin Ethereum has shed 30% of its value since the start of 2026. For context, the coin’s price has fallen from a January 1 close of $3,001 to $2,113 as of this writing.
This drawdown leaves ETH among the worst-performing major assets of the year, even as a handful of altcoins have attracted fresh capital and posted stronger relative performance.
As the anchor for broader altcoin rotations, ETH’s weakness has pushed the prospect of an altcoin season further out.
Altcoin season nowhere in sight, ETH/BTC ratio at 10-month lows
According to Blockchain Center, an altcoin season begins when at least 75% of the top 50 altcoins outperform BTC over a three-month period.
New data from the on-chain analytics platform shows that only 29% of these tokens have outperformed BTC over the past 90 days—significantly below the required threshold.
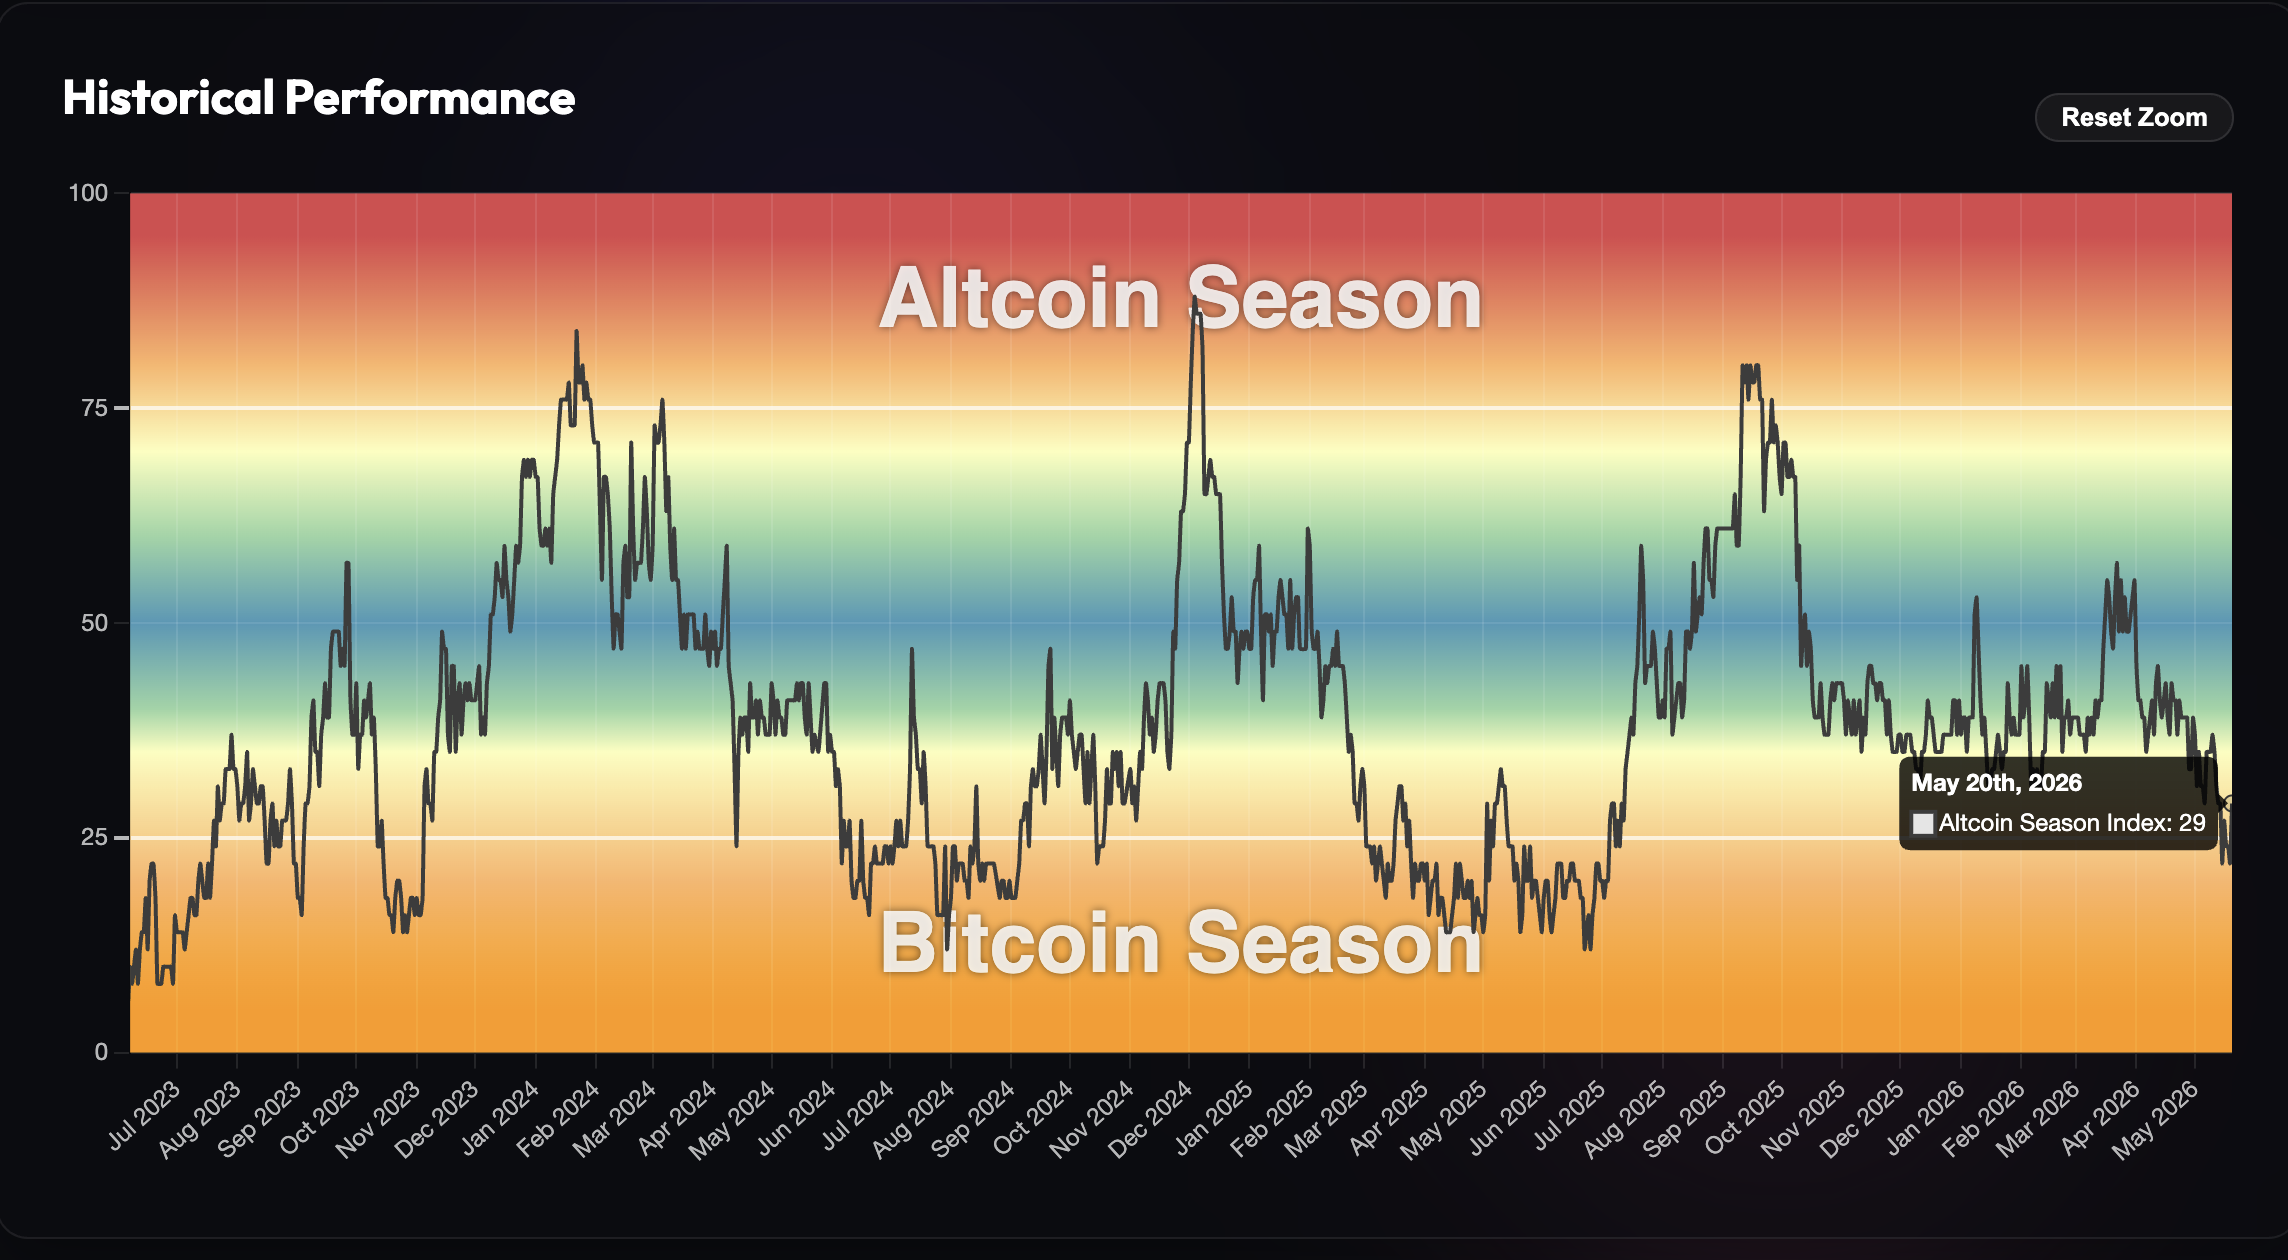
This means capital is still concentrating in BTC rather than rotating out into the broader altcoin market.
The decline in the ETH/BTC ratio confirms this trend. As of this writing, it sits at 0.0275, its lowest level since July 2025.
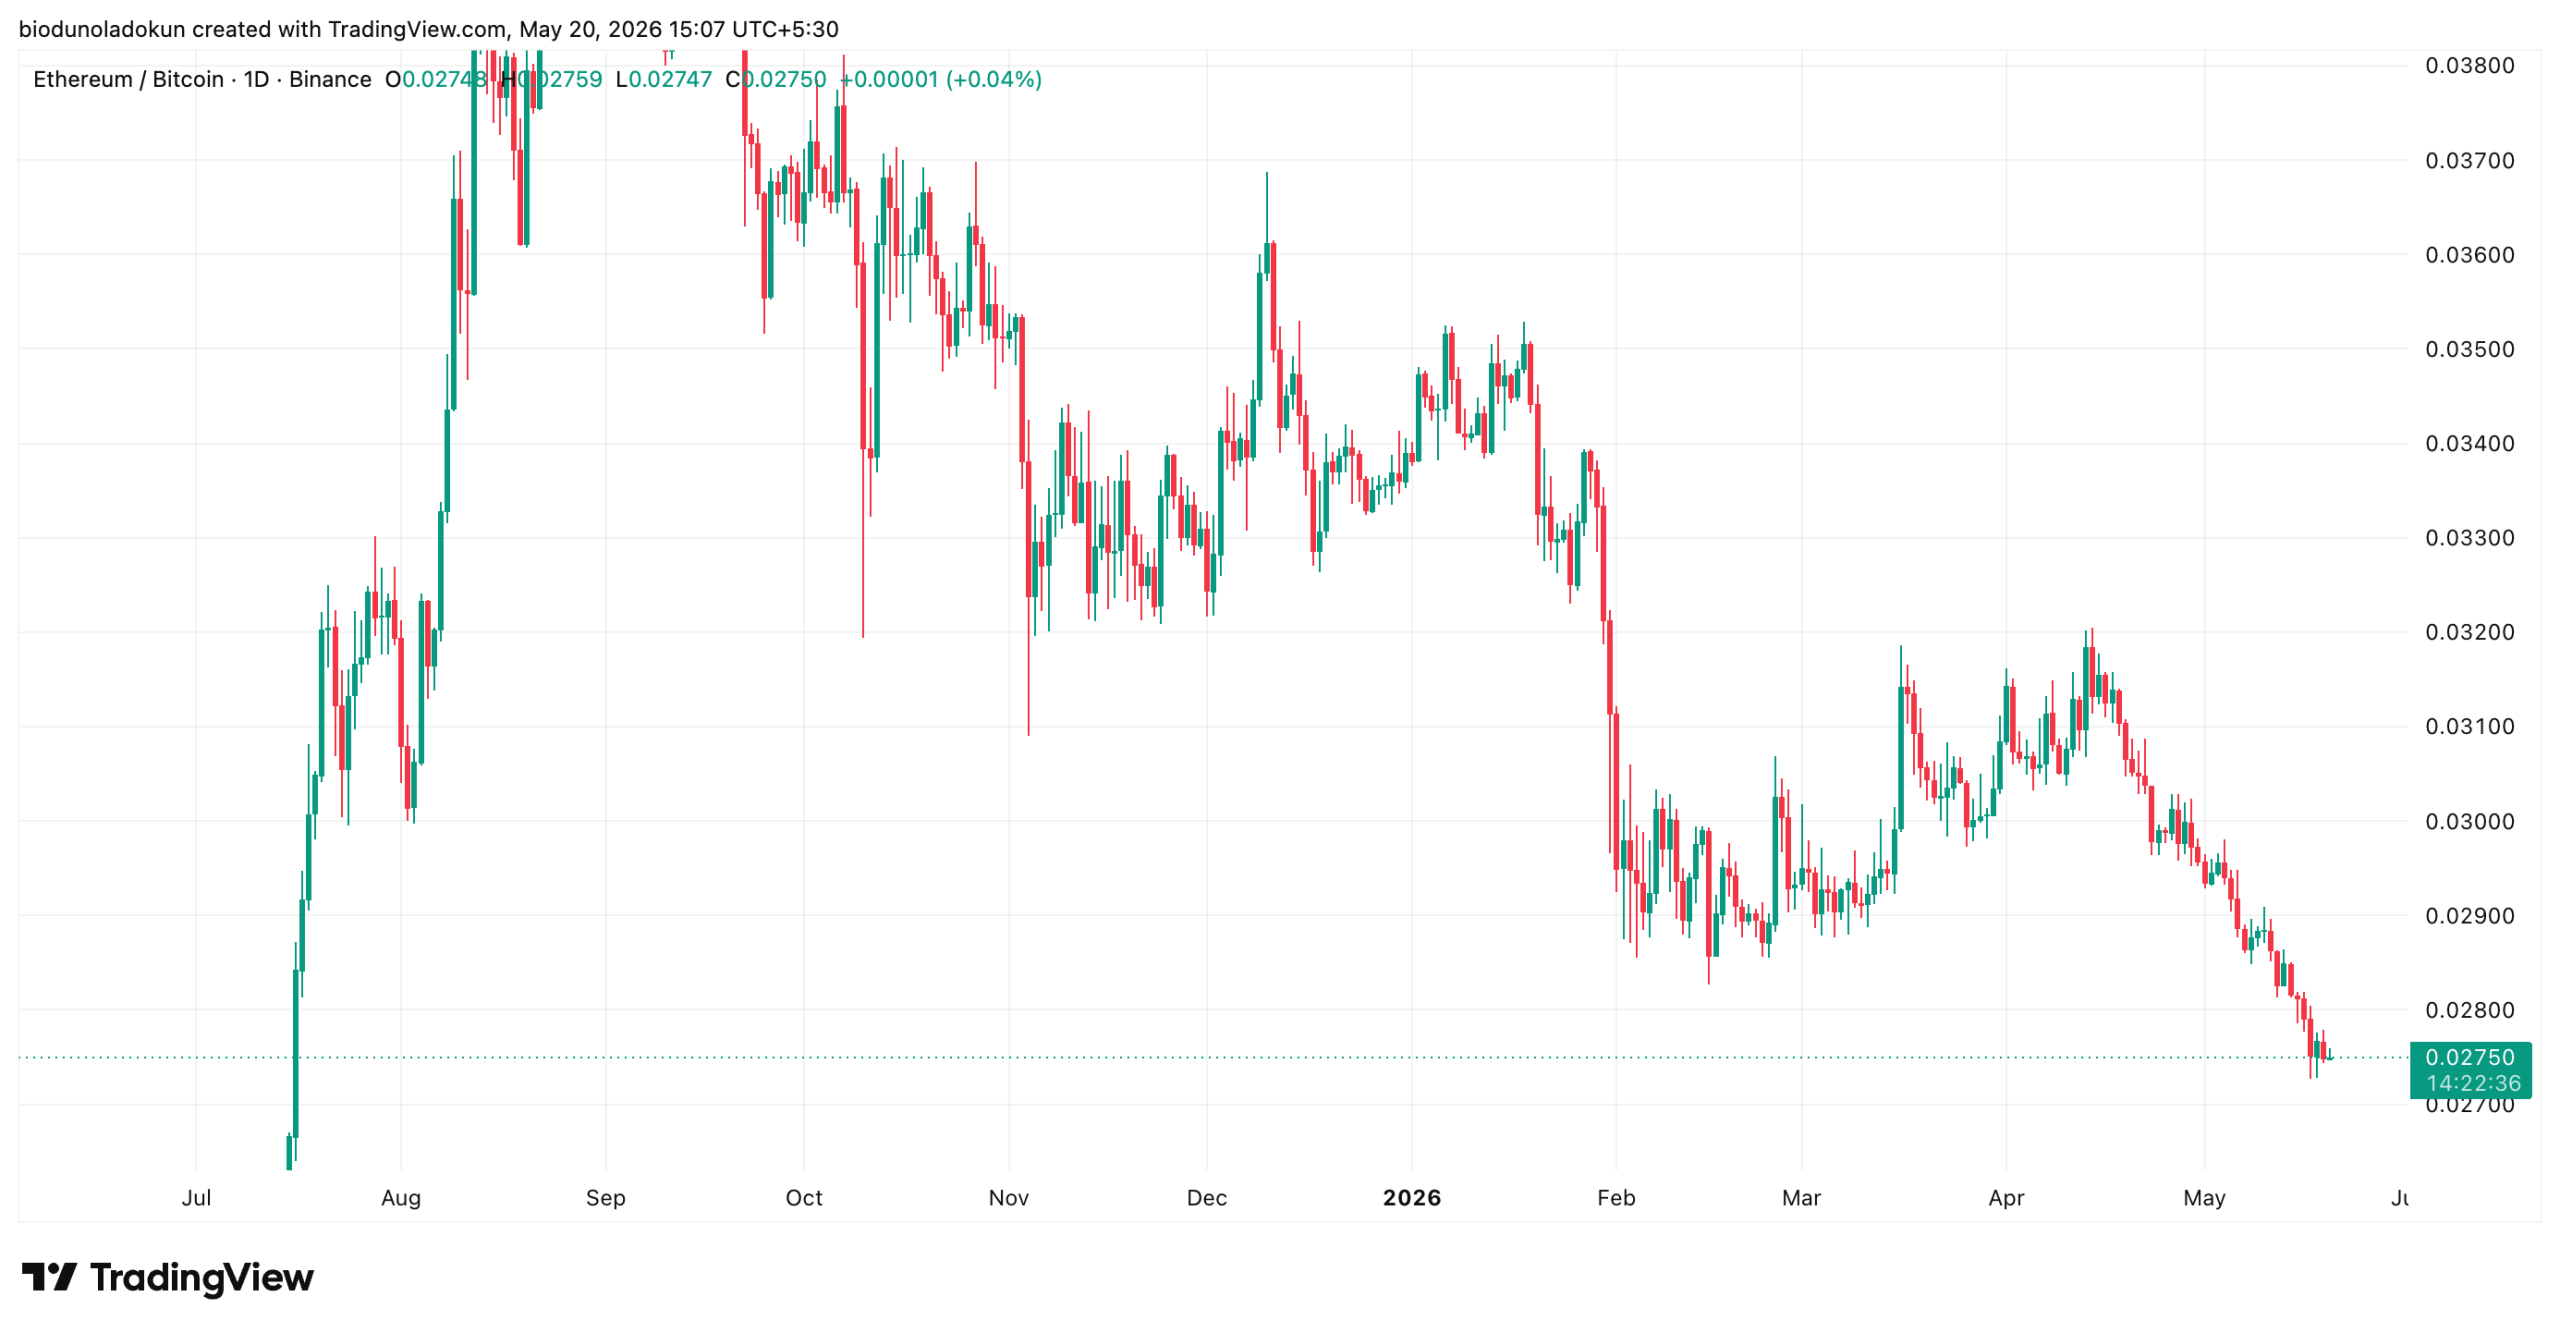
This ratio measures ETH’s relative value compared to BTC. When the ratio rises, it indicates that ETH is outperforming BTC, either because the altcoin’s price is growing faster or the king coin’s price is falling.
Conversely, when it falls steadily as it has now, BTC is gaining strength relative to ETH.
It suggests that traders are moving capital into BTC, seeing it as a safer or more profitable investment at the moment despite its own price troubles.
ETH-Backed Products See Outflows
The sustained institutional capital exit from ETH-backed products has compounded its price weakness.
According to CoinShares’ latest weekly fund flows report, ETH investment products saw $249.3 million in exits last week, representing their largest single-week outflow since January 30.
Per the report, the redemptions came as part of a broader $1.07 billion outflow across digital asset investment products for the week ending May 16.
This marked the third-largest weekly withdrawal of 2026 and the first negative print after six consecutive weeks of inflows.
Furthermore, inflows into spot ETH exchange-traded funds (ETFs) have stalled since the beginning of May. SoSoValue data shows two consecutive weeks of net outflows, totaling $404 million.
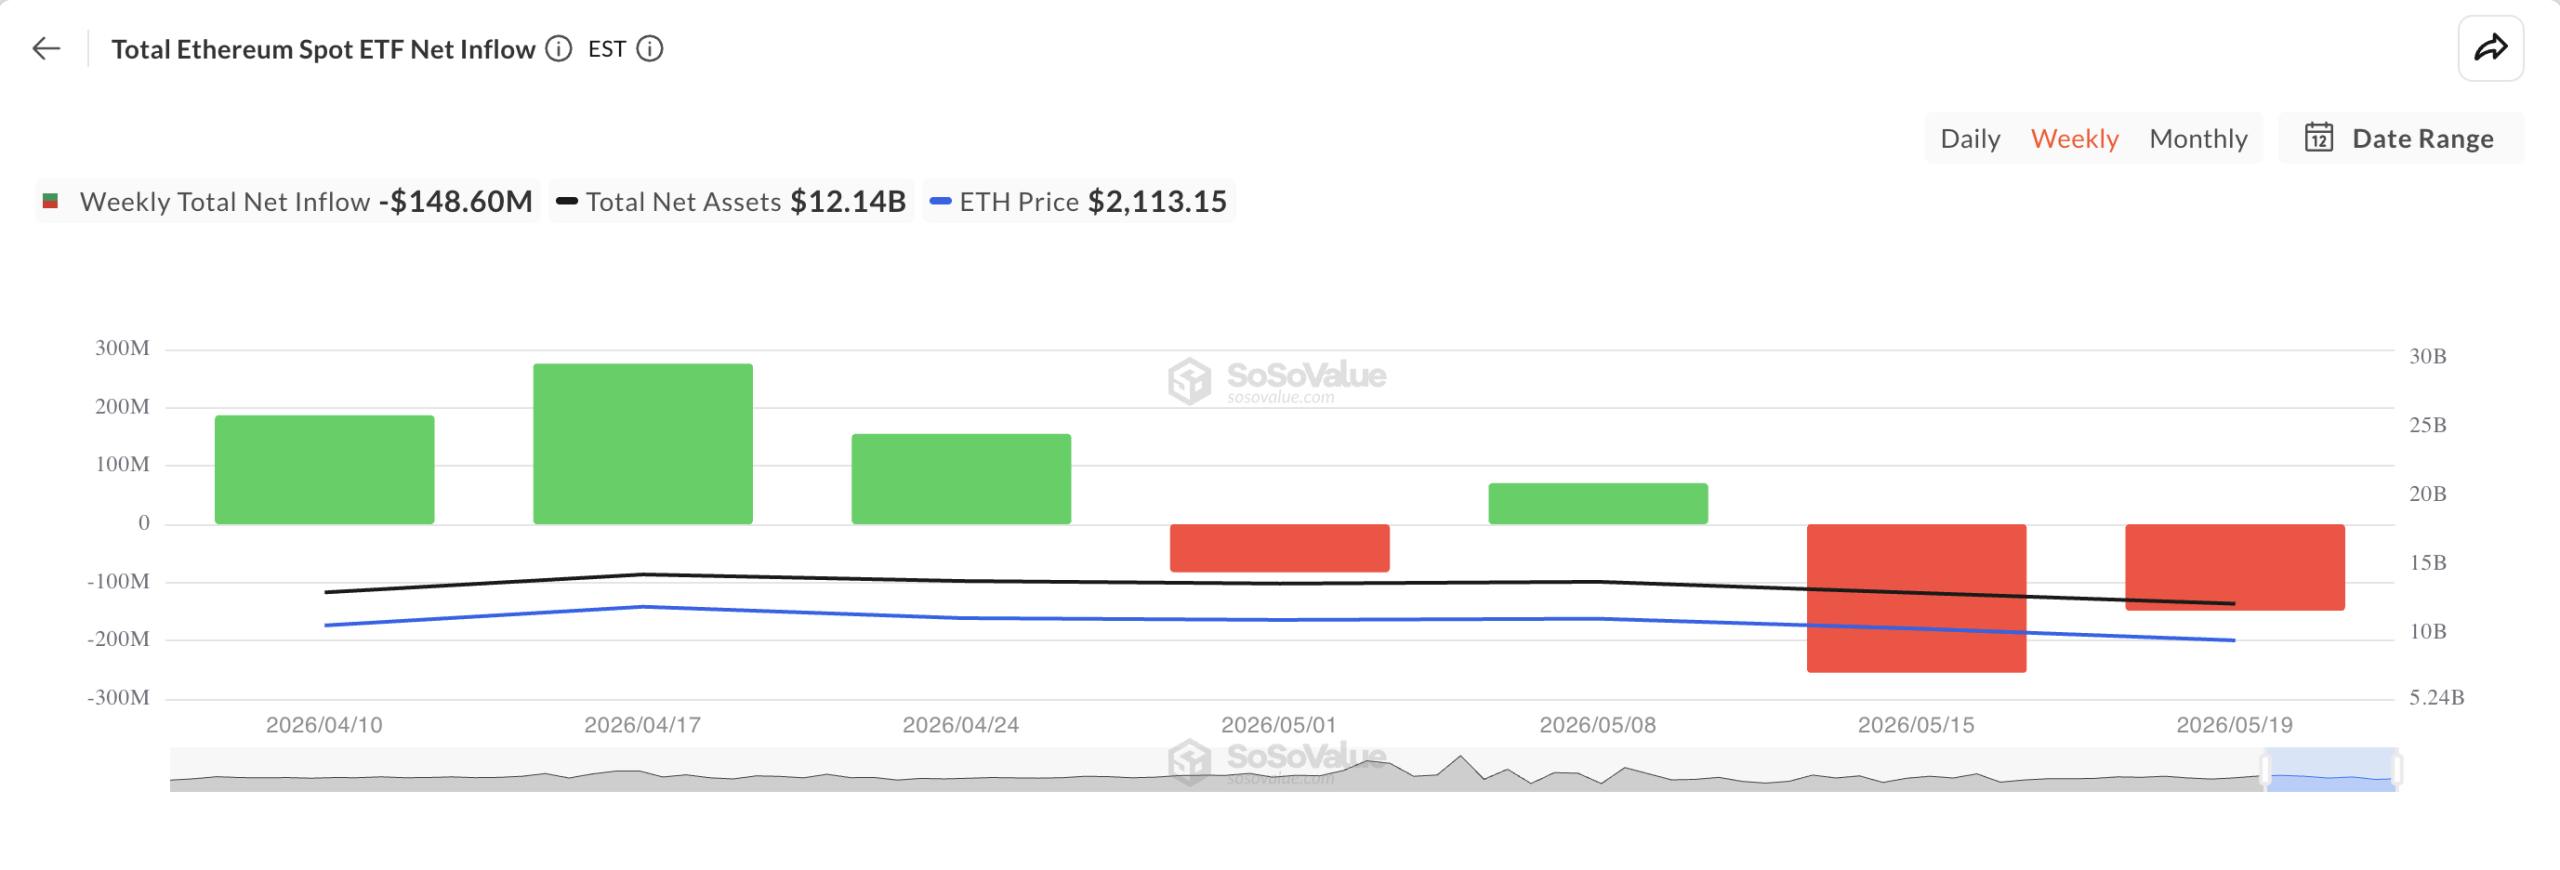
As of this writing, total net assets across spot ETH ETFs sit at $12.14 billion, down 23% from its year-to-date peak of $15.86 billion last seen in January.
In addition to dropping institutional interest in ETH, short-term holders have also significantly distributed their coins over the past few weeks.
Per Glassnode, these are investors who have held their coins for one to three months and are usually the most reactive to price moves.
They have offloaded 14% of their holdings since April 26, and currently hold 5.54% of ETH’s circulating supply.
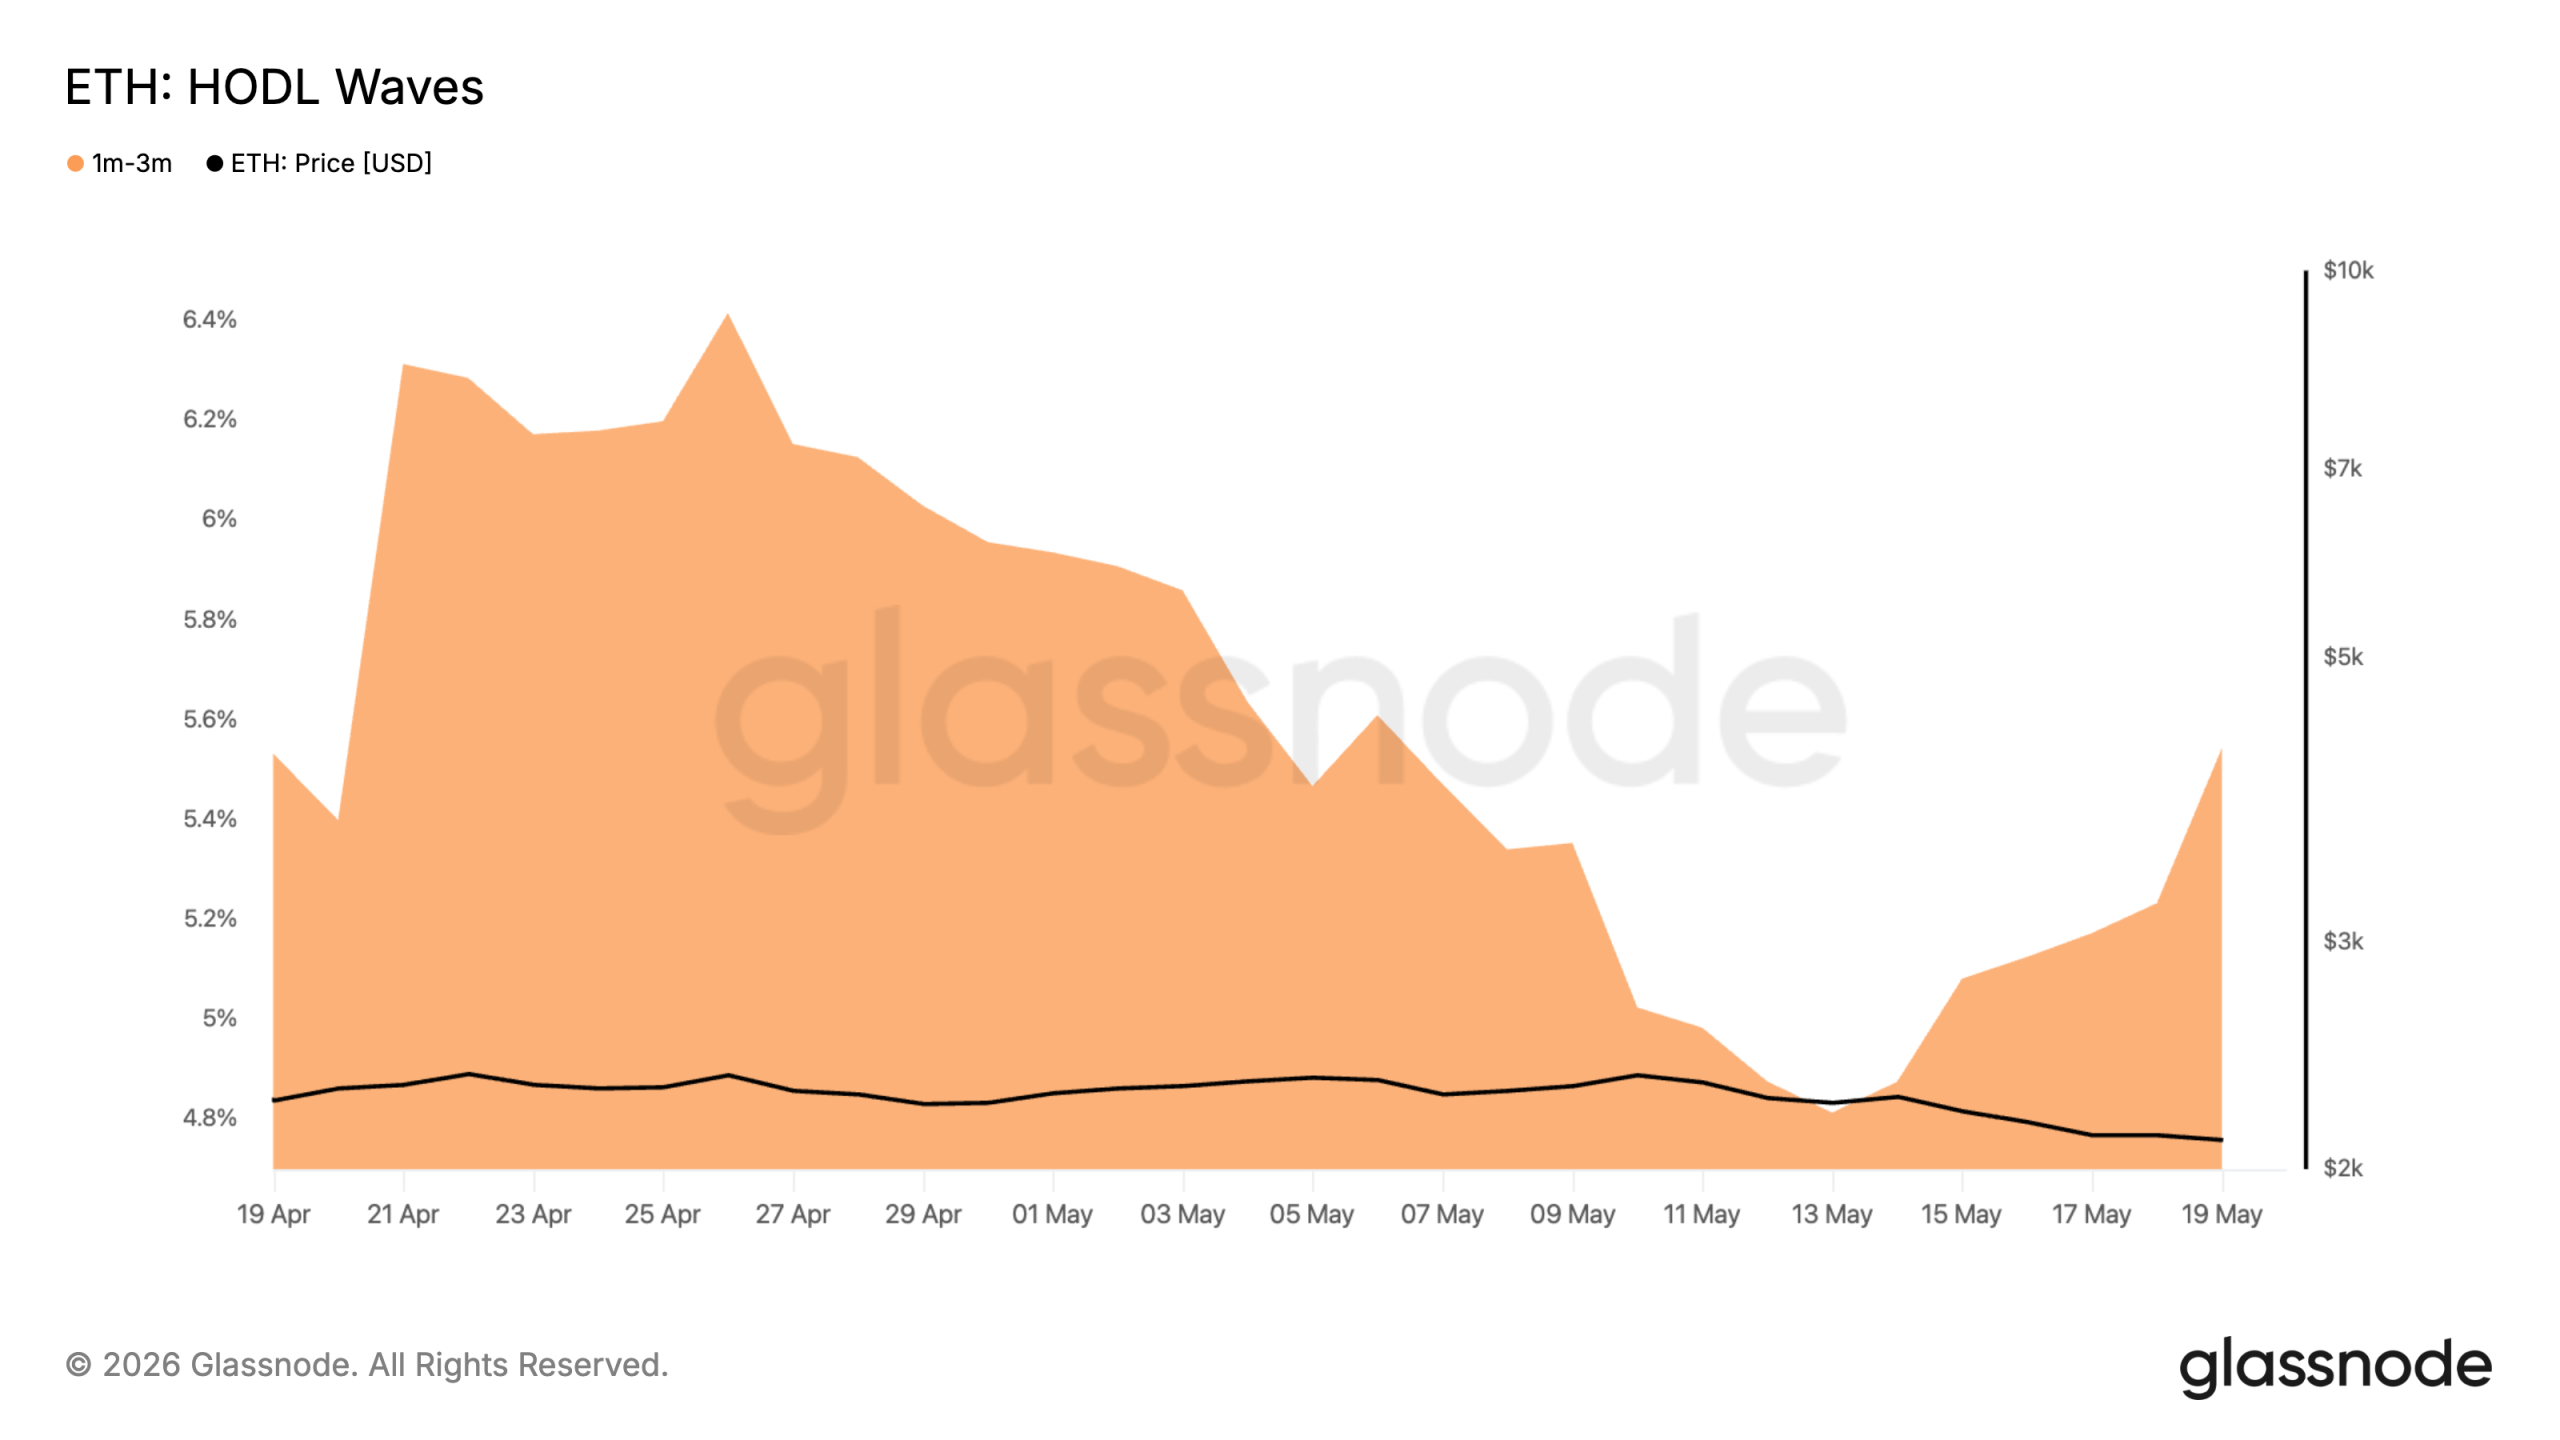
This dip in short-term holdings is significant because this cohort’s behavior tends to drive near-term price action. When they aggressively distribute, the added selling pressure typically weighs on prices, opening the door to further downside in ETH.
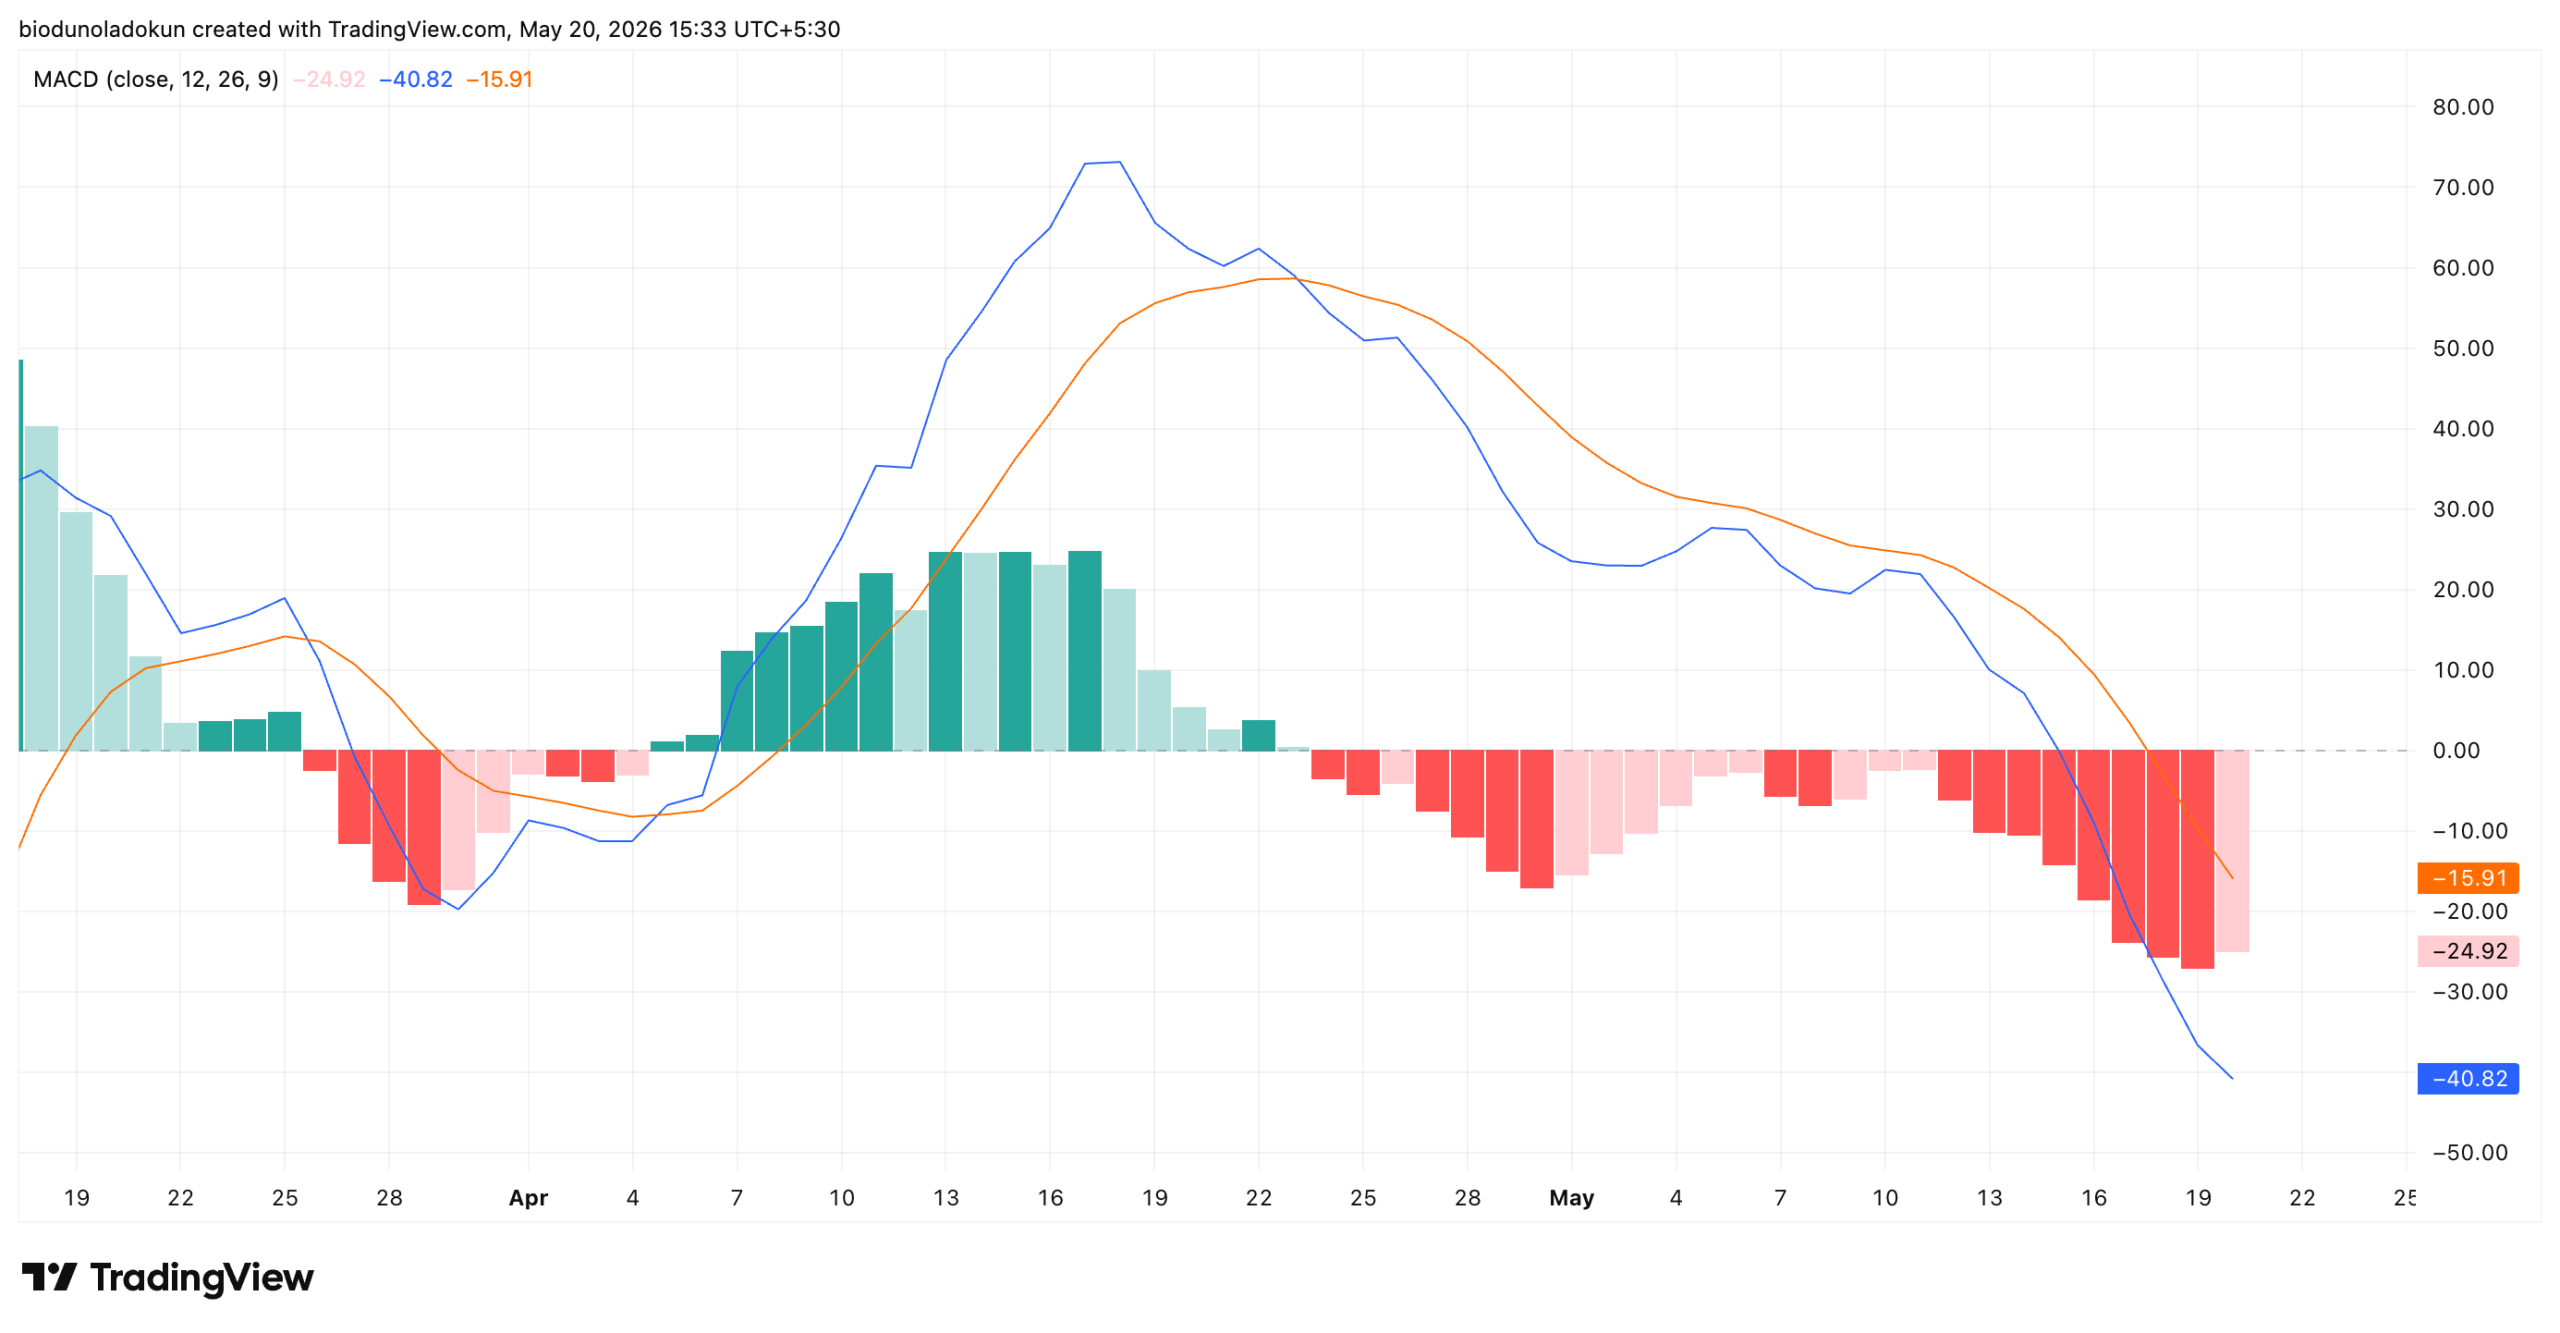
ETH Daily Chart Flashes Red
Readings from ETH’s daily chart support this bearish outlook. For example, at press time, its MACD line sits at well below the signal line, with the histogram printing a negative reading.
The widening gap between the two lines and the steadily deepening histogram bars since May 12 confirm that bearish momentum is increasing.
Also, ETH currently trades below the dots of its Parabolic Stop and Reverse (SAR) indicator. As of this writing, these dots form dynamic resistance above ETH’s price at $2,284, pushing it lower.
The Parabolic SAR indicator identifies an asset’s potential trend direction and reversals. When its dots are placed below an asset’s price, the market is in a downtrend. It confirms the supply overhang above ETH’s price, which may continue to keep it low.
ETH Price Prediction
At press time, ETH trades at $2,133 up 1.33% on the day. However, the broader trend remains tilted to the downside as established above.
If ETH’s price continues to plummet, $2,044 stands as the first line of defense. A breakdown here exposes the altcoin to $1,934, with $1,828 marking the last floor before the February swing low at $1,754.71 comes back into focus.
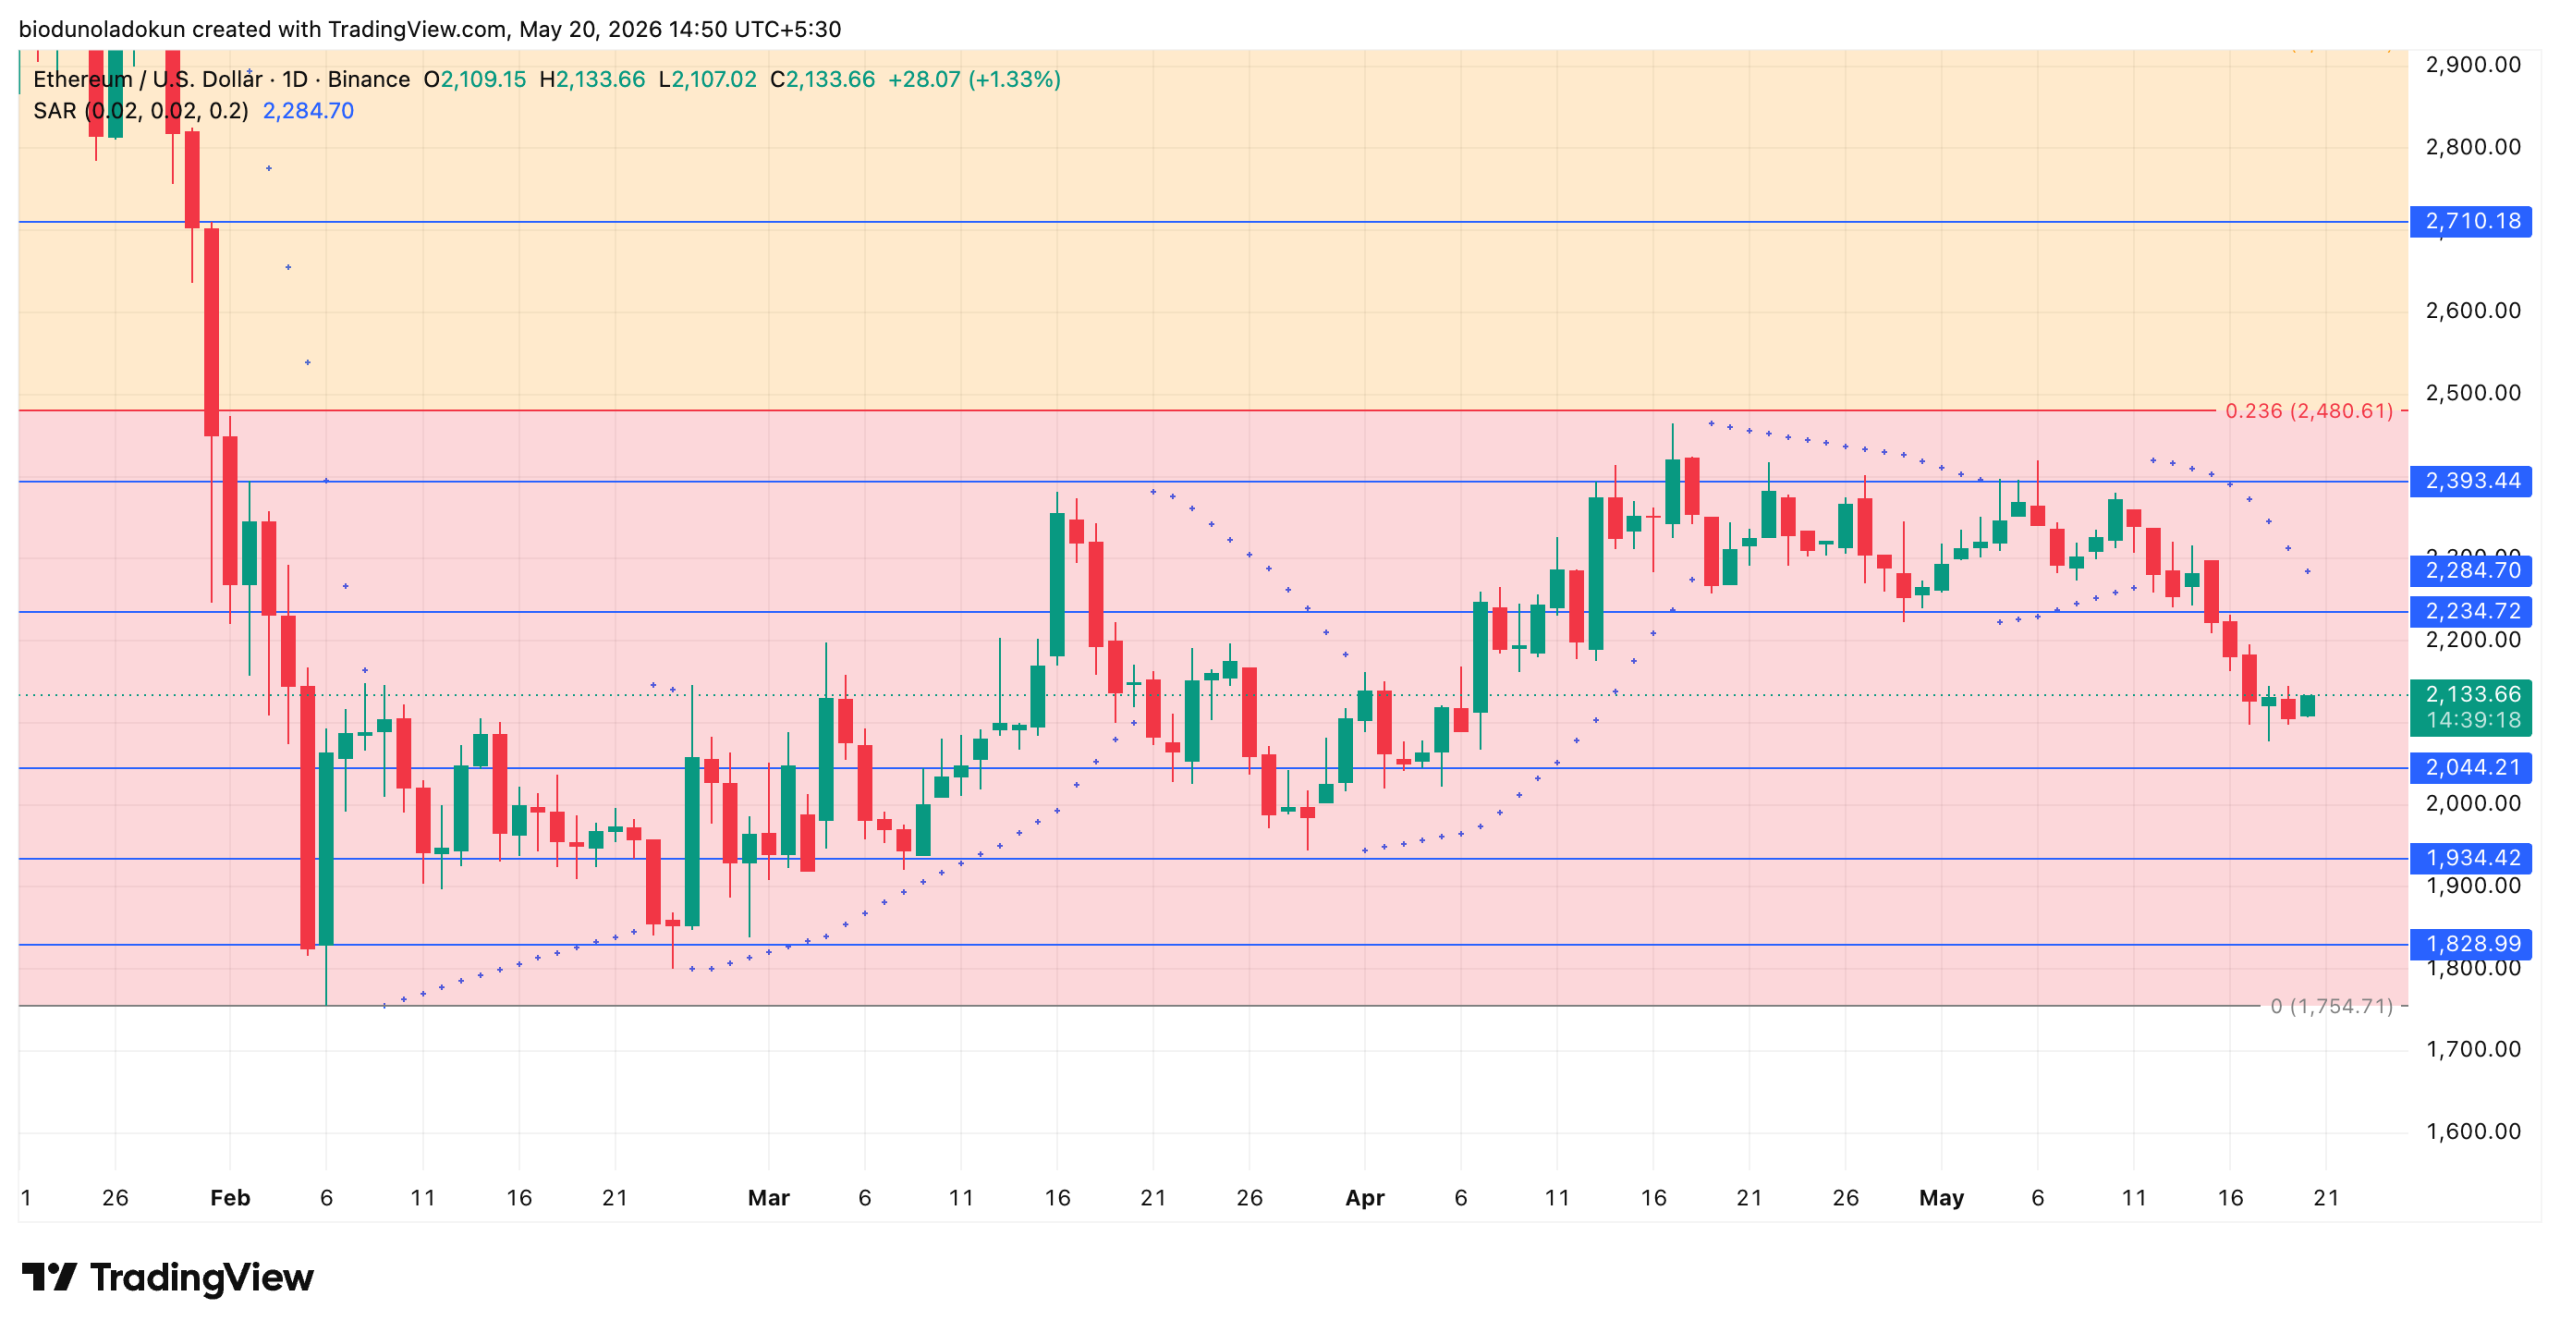
For ETH to invalidate the bearish projection, the price needs to reclaim the $2,234.72 resistance on a daily close. A clean break above the latter would open the door for a retest of the $2,394 ceiling.
[You-may-like]
The information provided in this article is for informational purposes only. It is not intended to be, nor should it be construed as, financial advice. We do not make any warranties regarding the completeness, reliability, or accuracy of this information. All investments involve risk, and past performance does not guarantee future results. We recommend consulting a financial advisor before making any investment decisions.

Abiodun Oladokun is a Research Analyst at CCN, where he covers cryptocurrency markets with a focus on on-chain analysis, technical assessments, and emerging trends across decentralized finance (DeFi), real-world assets (RWA), artificial intelligence (AI), decentralized physical infrastructure networks (DePIN), Layer 2s, and meme coins.
Prior to CCN, he served as a Senior On-Chain Analyst at BeInCrypto, producing market reports spanning diverse crypto sectors.
Before that, he conducted technical analysis and market assessments of various altcoins at AMBCrypto, where he also contributed long-form quarterly research papers on DeFi, NFTs, DAOs, and scaling architectures, leveraging on-chain platforms including Messari, Santiment, DefiLlama, and Dune Analytics.
He began his crypto career as a research analyst at SixthSense DAO, developing blockchain forensic tools to trace the history of stolen assets.
Abiodun is a lawyer called to the Nigerian Bar and the founder of Ilé Ijó, a Lagos-based electronic dance music collective.