

Mike
The team at Goldman Sachs put out an interesting note earlier this week. Their team asserted that the recent increase in market yields has more to do with a more sanguine growth outlook rather than the Fed needing to be more hawkish to clamp down on inflation. While 2-year breakeven inflation rates have increased this month, broad economic data, including manufacturing surveys, appear to be turning the corner, though concerns about the US consumer remain in play.
The bottom line here is that stronger, more cyclical, economic growth should benefit companies away from just large-cap US tech stocks. That favors funds better diversified than the concentrated S&P 500. We are already seeing it play out in markets.
Consider that over the last month, the Information Technology sector has been underperforming the SPX. What’s leading? Risk-on spots such as Consumer Discretionary and Industrials – both up 6% since late January. Healthcare and Materials are up 5% each with Financials posting a solid 4% advance. This bodes well for holders of a popular yield-focused fund.
I have a buy rating on the Schwab U.S. Dividend Equity ETF (NYSEARCA:SCHD). Amid more bullish participation in the market, but also ahead of what has been a bearish month, I see alpha opportunities in this ETF compared to owning the S&P 500.
Improved Growth Expectations Push Yields Higher – Good News is Good News Again?
Goldman Sachs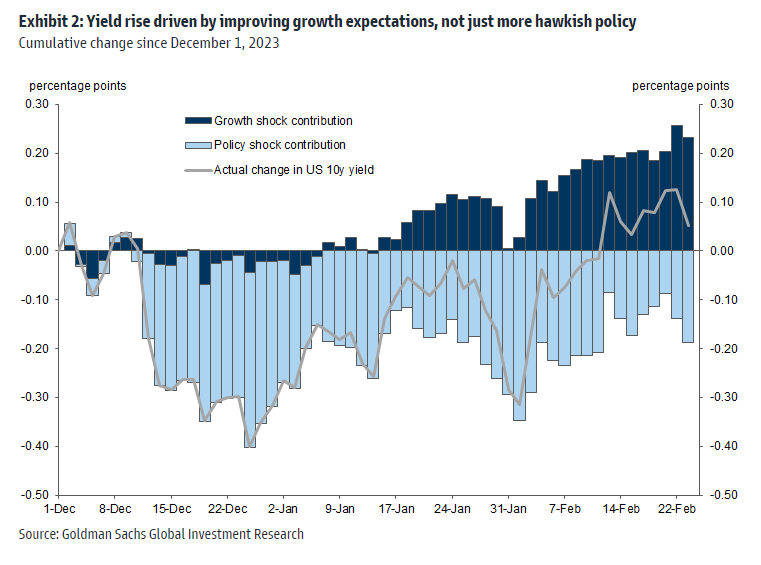
According to the issuer, SCHD seeks to track as closely as possible, before fees and expenses, the total return of the Dow Jones U.S. Dividend 100 Index. Schwab notes that the ETF is straightforward and a low-cost option for investors, offering potential tax-efficient returns. Given its diversified construct, SCHD can be a core holding for an income-driven investor since the portfolio focuses on owning shares of high-quality companies that pay sustainable dividends. Through its screening process, SCHD invests in stocks based on fundamental strength relative to their peers, based on financial ratios.
SCHD is a large fund with total assets under management (AUM) of more than $53 billion and it pays a high 3.4% trailing 12-month dividend yield – more than twice that of the S&P 500. What’s more, SCHD sports a superb A+ ETF Grade on its low 0.06% annual expense ratio. Share-price momentum has been somewhat soft lately, however, and I will analyze the trend situation later in the article. Risk metrics are also not all that rosy, per Seeking Alpha, given a high percentage of assets in its top 10 holdings and 28% annual portfolio turnover. Still, SCHD is a highly liquid ETF given average daily trading volume of 3.9 million shares and a 30-day median bid/ask spread of just a single basis point.
Digging into the portfolio, the 5-star, Gold-rated ETF by Morningstar plots in the upper-left corner of the style box. Its large-cap value bent should benefit from a broadening out in the equity market rally considering the bullish price action in cyclical and value sectors over the last month.
But investors should also acknowledge SCHD’s material 25% allocation to domestic mid- and small-sized companies, so there is added risk compared to a strictly large-cap portfolio. What I particularly like about the fund today is that it trades at a very low price-to-earnings multiple. Now under 15x, it is nearly six turns less expensive than the SPX, though earnings quality plots low on the factor view.
SCHD: Portfolio & Factor Profiles
Morningstar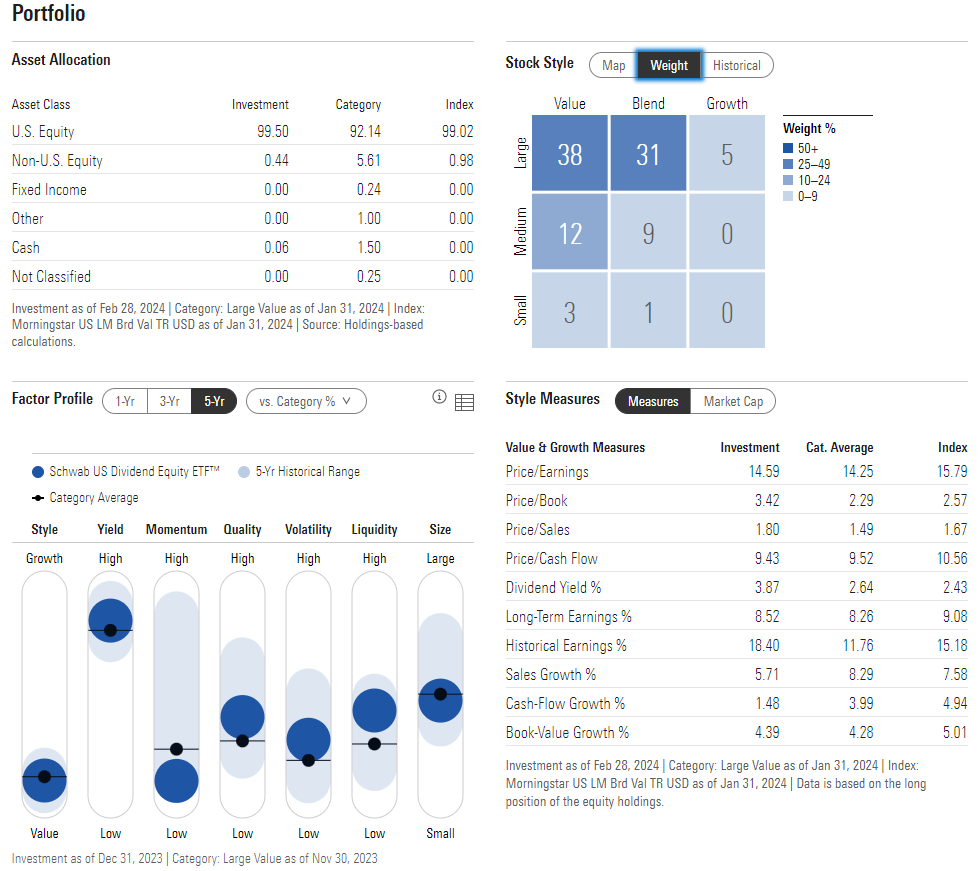
The major difference compared to most other cap-weighted US equity indices is that SCHD’s weight in the Information Technology sector is just 12.8% – about 15 percentage points underweight versus the S&P 500. Diversification, sector-wise, is high since seven of the market’s 11 sectors command at least a 9% weight in the fund.
Energy, for instance, is a significant overweight, which has contributed to SCHD’s relative weakness in the last year. Keep your eye on the spot price of WTI crude oil, though, as it ventures near 4-month highs – a breakout there could help lift SCHD as we approach the second quarter. Finally, while there is a large weight in its top 10 holdings, the mix of those stocks is diversified across sectors, so I am not overly concerned about single-stock risk with SCHD.
SCHD: A Diversified Sector Allocation, Cyclical and Defensive Stocks Present
Seeking Alpha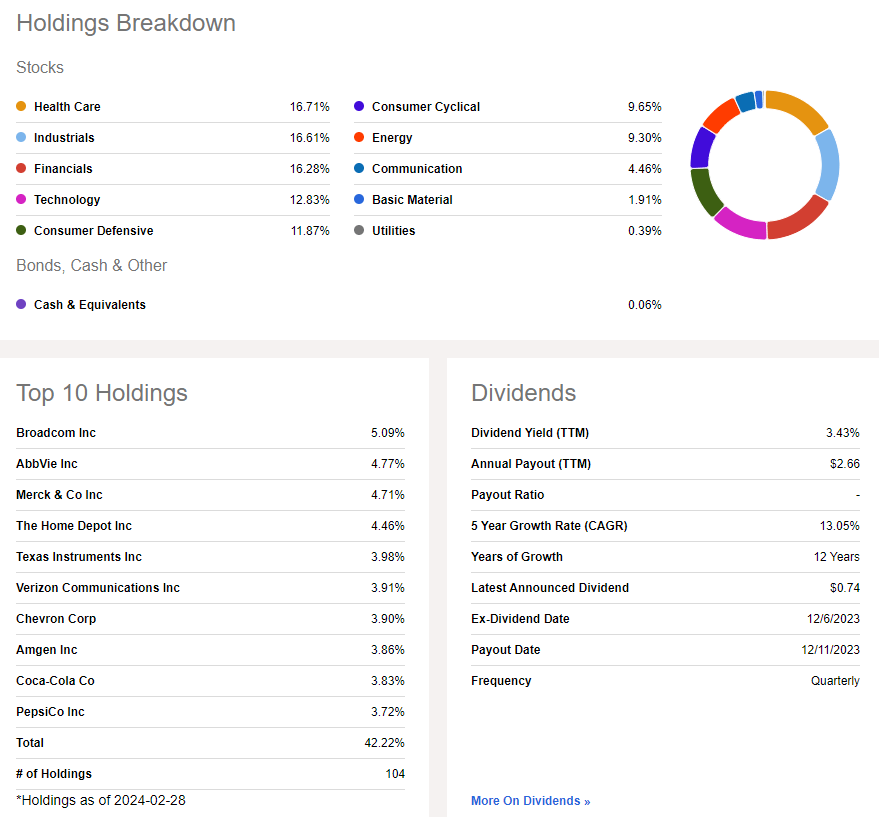
Value Increasing Cheap Versus Growth
Yardeni Research
What could be a near-term challenge is the seasonal pattern. March is historically a soft month, a period in which volatility has commonly spiked in the US stock market. But the April through August period is often strong. Thus, paying attention to entries and exits over the next few weeks is extremely important.
SCHD: Mildly Negative March Trends
Seeking Alpha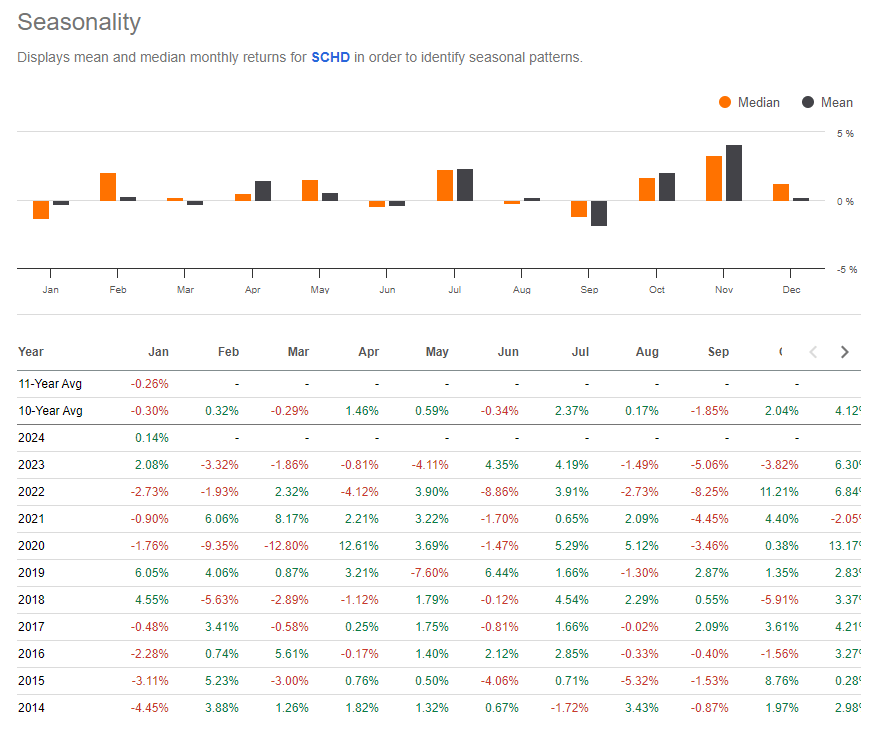
The Technical Take
With a low valuation, solid diversification, and cyclical exposure, SCHD’s chart has conflicting indicators. Notice in the graph below that the fund broke out from a bearish downtrend dating back to late 2021. After peaking above $82 on the price-only chart, the fund dipped to the $66 to $67 area. A bullish double-bottom technical pattern was confirmed late last year during the market’s July through October correction. A strong year-end rally, which included a gap higher in price around the December Fed meeting date, helped send SCHD through its then-falling long-term 200-day moving average.
The last several weeks have featured a slow increase in the ETF’s price. That is a risk, though, since the ascent has come amid a downtrending RSI momentum oscillator. Technicians consider that bearish momentum divergence. Hence, I would like to see SCHD’s momentum improve to confirm the recent 52-week high. But here’s where I am optimistic – based on the $14 range from the previous descending triangle pattern ($70 to $66), the ETF has an upside measured move price target to $88 ($14 added on top of the late-2023 $74 breakout point).
Overall, the chart is constructive, but I’d like to see momentum increase over the coming weeks and months.
SCHD: Bullish Breakout, But Weakening RSI Momentum, Upside Target $88
Stockcharts.com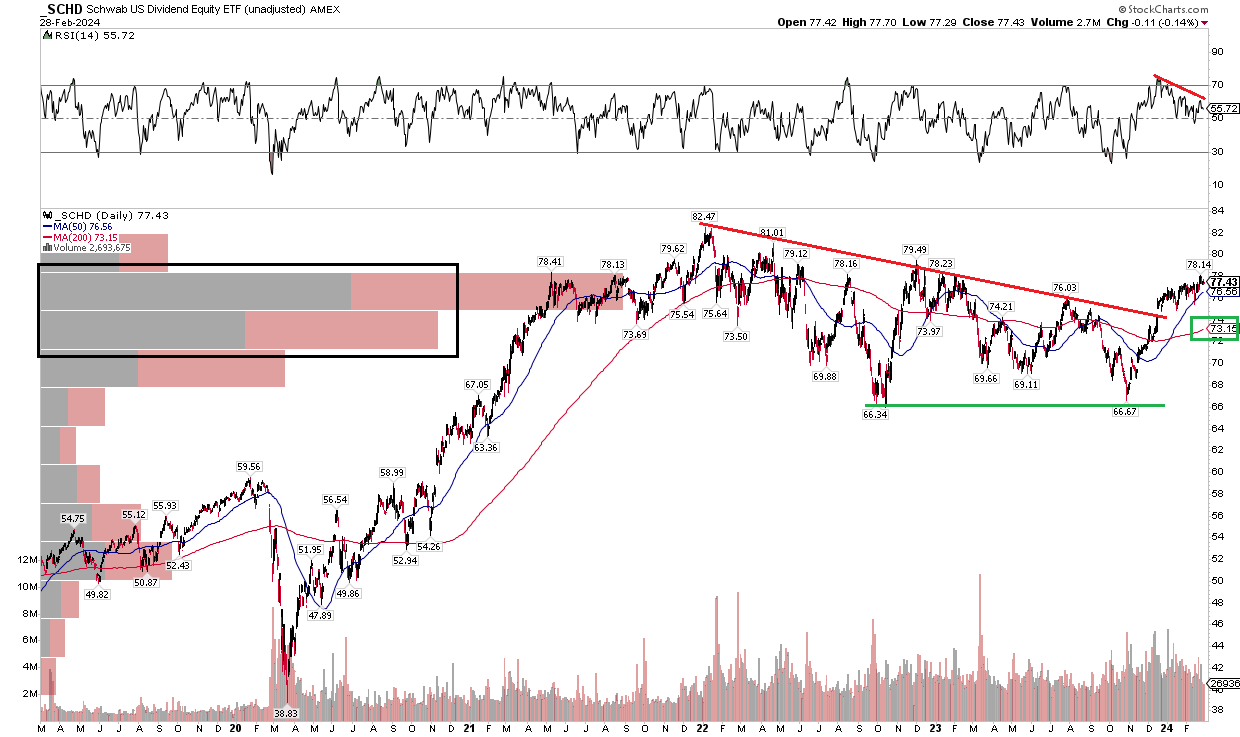
The Bottom Line
SCHD has sharply underperformed the S&P 500 over the past year. Up just 8% total return compared to the SPX’s 30% performance, the tide may be turning in favor of inexpensive dividend-yielding companies from cyclical and value areas of the market. While SCHD’s current momentum is soft, the macro landscape may be shifting which would benefit the ETF’s strategy.


