


Nifty : 24103
Technical Outlook
Day that was .. Indian equity benchmarks settled higher, tracking positive global cues. The Nifty closed at 24,103, up 0.40%. Market breadth was in favor of advance with an A/D ration of 2:1. Broader markets outperformed, with the Nifty Smallcap gaining 0.60%. Sectorally, Pharma, Oil & Gas, and BFSI drove the market, while FMCG and Consumer Durables were the only major indices to close in the red.
Technical Outlook :
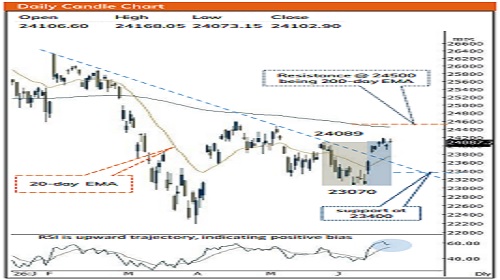
• Nifty opened the week with a positive gap and oscillated within ~90-points range after approaching its 100-day EMA. Consequently, the daily price action formed a breakaway candle with higher highs and lows, indicating a continuing positive bias amid elevated volatility.
• The key highlight is that the index is consolidating above its 4- month falling trendline while forming a higher base above its cluster of short-term 20-day and 50-day EMA, indicating underlying resilience and bullish momentum. Therefore, we believe the uptrend remains intact, which should gradually drive the Nifty toward the 24,500 milestone in the coming weeks.
• The daily stochastic oscillator has cooled off to 80 from last week’s reading of 98. This mild profit booking helps cool overbought momentum, ultimately creating a healthier market structure and building a strong base for the next leg of the up-move. Hence, any decline should be used to accumulate quality, high-earning stocks, as strong support holds at 23400 Our Constructive bias is based on following observation :
• With past five sessions ~1100 points rally Nifty has entirely recouped past 12 sessions decline. The faster pace of retracement signifies structural improvement
• The ratio chart of Bank Nifty vs Nifty is at the cusp of breaking out from a 5-years consolidation. This technical setup signals that the banking index is poised to accelerate its relatively outperformance and head towards 59300 in the coming month.
• Brent Crude oil prices declined 8% and finally trading below its long-term 200-day EMA (placed at $82). Sustenance below this level would eventually help to reduce India’s import bill, acting as powerful tailwind for Indian equities
• The Midcap index is just 1% away from its All Time High, while catch up activity exhibited in the Nifty small cap which has logged a resolute breakout from 18 months falling trendline
• The current upmove is backed by improvement in market breadth as currently 69% of stocks within Nifty 500 universe are trading above their 50 days EMA compared to last week’s reading of 65%. Improvement in market breadth signifies broadening of rally.
Intraday Rational :
• Trend – Index is taking breather after 1100 points rally seen over in recent past
• Levels – Buy around 61.8% retracement of last 2 days range
Nifty Bank : 57936
Technical Outlook
Day that was : Bank Nifty Index regained momentum after breather and closed the day on positive note up 0.4% at 57936 on back of mixed global cues.
Technical Outlook :
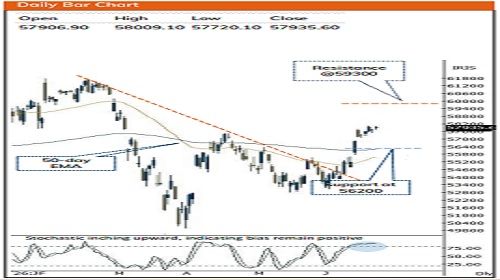
• Post initial decline Index witnessed supportive efforts from 50% retracement of two days range around 57700 levels indicating elevated buying demand. The daily price action resulted into high wave like candle with higher high-higher low formation, indicating positive bias.
• Going ahead, we expect Index to gradually resolve higher and head towards target of 59300 levels in coming month as it is 80% retracement of Feb26-April26 decline. However, its is important to highlight that over post 3 weeks (9.5%) rally stochastic oscillator is in overbought territory(87)levels, so we believe couple of days breather cannot be ruled out which would make markets healthier and set the stage for next leg of up move. Our view is based on following observations
• A) Index has retraced past twenty-eight days decline in just 13 sessions, indicating faster pace of retracement.
• B) Key point to highlight is that after five-year consolidation the Ratio chart of Banknifty vs Nifty is on the verge of breakout indicating relative outperformance of BankNifty in comparison to Nifty
• The formation of higher high-low on the weekly chart makes us revise support upward towards 56200 levels being 200-day EMA coinciding with 38.2% retracement of current up move(53027- 58021)
• PSU Bank Index has also formed bull candle with higher high higher low post breather, sustaining above cluster of short-term moving averages, signifying uptrend intact. Going forward we expect Index to head towards 9100 levels in coming weeks being April 2026 highs coinciding with 61.8% of Feb-April 2026 decline. Intraday Rational :
• Trend – Supportive efforts from 50% retracement of two days range around 57700 levels indicating elevated buying demand.
• Levels – Buy around 61.8% retracement of last 2 days range
Please refer disclaimer at https://secure.icicidirect.com/Content/StaticData/Disclaimer.html
SEBI Registration number INZ000183631