

Summary: ROE usually trails ROCE, but the relationship can flip when debt amplifies returns to shareholders. This analysis examines 312 large listed companies to show what drives the gap, and why investors should look beyond the headline ratios.
Debt is similar to seasoning in a dish. Added in the right amount enhances the taste. Add too much and it overpowers everything else.
The same applies to borrowing. While debt undoubtedly raises a company’s financial risk, used with care, can magnify returns for shareholders.
Here’s another way to put it: using debt the right way can lift a company’s return on equity (ROE) well above its return on capital employed (ROCE). Before understanding why, let’s first learn what these two ratios actually mean.
What a company’s ROE and ROCE measure
ROE tells us how much profit a company earns for every rupee of shareholders’ money invested.
ROE = Profit after tax (PAT) / Average shareholders’ equity
ROCE looks at the return on the entire capital employed in the business, both equity and debt.
ROCE = Earning before interest and taxes (EBIT) / Average capital employed
In plain terms, ROE asks: How well is the company using shareholders’ money? On the other hand, ROCE asks: How well is the business using all the money invested in it?
That difference also explains why ROCE is usually higher than ROE. ROCE measures operating profit before interest. ROE measures the profit left for shareholders after interest and tax. So in most businesses, borrowing costs and taxes eat up some of the return on capital before it reaches shareholders.
But sometimes ROE outpaces ROCE. And when it does, debt is often a key driver of the gap.
The numbers make it clear
We started with all listed companies and set aside banks, non-banking finance companies and insurers, since borrowed money is their raw material rather than a funding choice, which makes ROCE less meaningful for them. We also set aside holding companies. From what remained, we kept companies with a market capitalisation above Rs 10,000 crore and both ROE and ROCE above 12 per cent, measured on a three-year average and on a current basis. That left 312 companies. The visual below shows the findings.
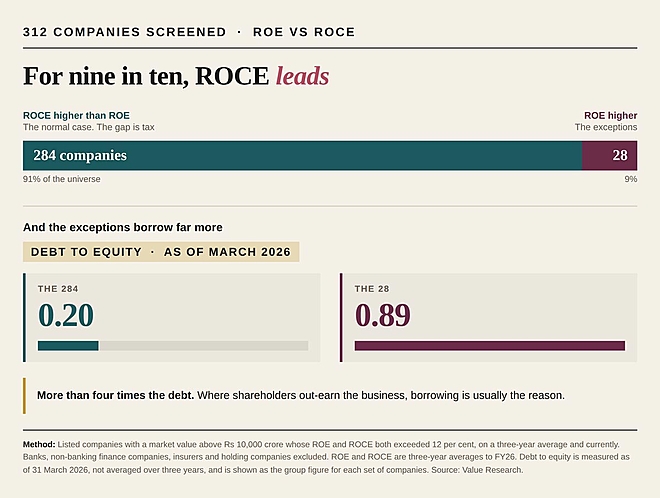
Of those 312 companies, 91 per cent showed a higher ROCE, the normal pattern. Only 9 per cent, or 28 companies, showed a higher ROE. And those 28 carried noticeably more debt: an average debt-to-equity (D/E) ratio of 0.89 times, against just 0.20 times for the companies where ROCE led.
How borrowing lifts shareholder returns
Suppose you invest Rs 100 into a business that earns 20 per cent on its capital. It produces Rs 20, and it’s all yours.
Now suppose the company adds Rs 100 of borrowed money to your Rs 100. Working with Rs 200 at the same 20 per cent, it earns Rs 40. Assuming the interest on the loan costs Rs 8, you are left with Rs 32.
The business itself has not changed. It still earns 20 per cent on the capital it employs, so its ROCE is unchanged. But you now earn Rs 32 on your Rs 100 instead of Rs 20.
The company borrowed at 8 per cent, put the money to work at 20 per cent and handed you the difference. That is financial leverage.
Let’s now look at the top 10 companies out of the 28 companies where ROE was greater than ROCE on both the three-year average and current basis. The table below shows the list.
When ROE races ahead
10 of the 28 companies where three-year average ROE exceeded ROCE
| Company | Sector | ROE 3Y avg (%) | ROCE 3Y avg (%) | Market cap (Rs cr) | D/E |
|---|---|---|---|---|---|
| Aegis Vopak Terminals | Energy & Utilities | 21.9 | 12.3 | 29,140 | 0.62 |
| Adani Power | Energy & Utilities | 45 | 25.7 | 3,95,818 | 0.82 |
| Hindustan Petroleum Corporation | Energy & Utilities | 30.7 | 19.6 | 77,165 | 0.78 |
| Schneider Electric Infrastructure | Energy & Utilities | 59.6 | 39.4 | 28,573 | 0.58 |
| Titan Company | Consumer Discretionary | 34.1 | 22.6 | 4,47,799 | 1.76 |
| Fujiyama Power Systems | Energy & Utilities | 36.2 | 24.9 | 13,541 | 0.88 |
| Tilaknagar Industries | Consumer Staples | 38.2 | 26.8 | 13,680 | 0.05 |
| CCL Products (India) | Consumer Staples | 17.1 | 13.8 | 14,723 | 0.56 |
| Sky Gold And Diamonds | Consumer Discretionary | 23.3 | 19.2 | 12,006 | 0.89 |
| Suzlon Energy | Industrials | 44.7 | 38.3 | 64,178 | 0.03 |
The list is notable for its sectoral concentration. Five of the 10 sit in Energy & Utilities. These are capital-heavy businesses that need large upfront investments in assets and infrastructure, making debt a natural source of funding.
Debt is not the only contributing factor
Debt is common among such companies, but it is not always the whole story. Other factors can also contribute to a higher ROE.
- Non-operating income is one reason. Interest on surplus cash, rent from spare property, or a share of profit from an associate all add to net profit, and so to ROE, without adding to the operating profit used in ROCE.
- Tax can tilt it too. Normally, tax is one reason ROCE leads, since ROCE is measured before tax while ROE is based on profit after tax. But a company recovering from years of losses can book a deferred tax credit once future profits look probable. That can push PAT above profit before tax, lifting ROE while leaving ROCE untouched.
Suzlon Energy is a case in point. Its PAT exceeded profit before tax (PBT) because of such a tax benefit, despite carrying very low borrowings. However, this is likely to be a temporary boost; as its past tax losses are utilised, the tax benefit should fade.
Finally, a small equity base can flatter ROE on its own. Years of losses erode reserves, so profit ends up measured against a much smaller equity base than the capital actually employed in the business.
What does this mean for investors?
A lower ROCE than ROE is not a warning sign. It is the normal case, as seen in most companies.
When ROE runs above ROCE, debt is often the reason. Used well, leverage lifts returns for shareholders. Used carelessly, it magnifies the pain when the economy slows, or the business hits trouble.
So when ROE sits well above ROCE, ask why. Is the company using debt efficiently, or is ROE being flattered by a small equity base, non-operating income or a one-off tax credit?
This is also why the ratio deserves a place in the long-term, value-minded toolkit rather than a quick screen. A high return tells you the number. Knowing what drives it tells you whether it will still be there in five years.
In short, do not just look at how high the return is. Look at what is driving it.
Also read: Why a high ROCE doesn’t guarantee a good stock
This article was originally published on September 04, 2026.