
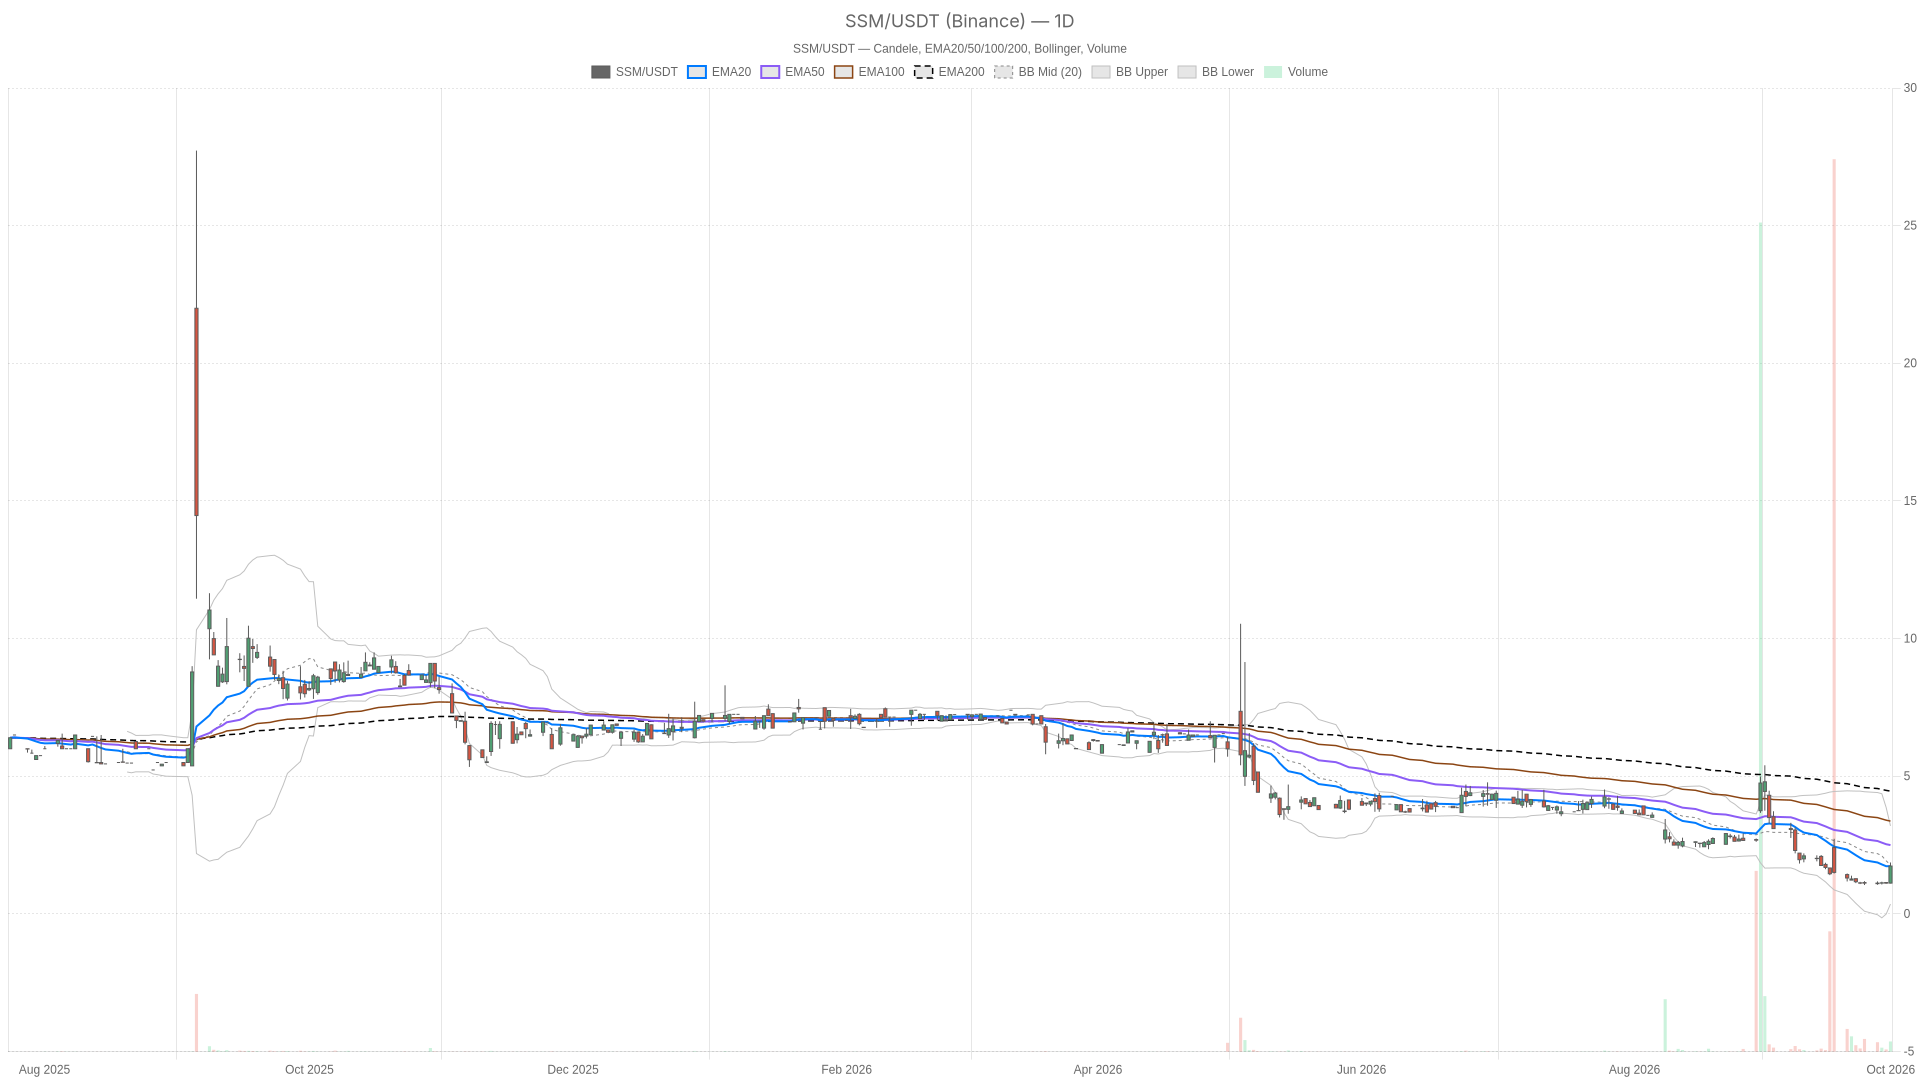
Sono Group (SSM) was trading at $1.74 as of 15:22 ET on Thursday, up 55.36% from Wednesday’s close of $1.12. Volume reached 420,861 shares, reflecting real participation behind the surge.

Key takeaways
- Sono Group (SSM) was trading at $1.74 as of 15:22 ET on Thursday, up 55.36% from Wednesday’s close of $1.12.
- Volume of 420,861 shares signals genuine participation behind the intraday surge.
- The daily structure remains bearish-leaning, with price below the 50-session EMA at $2.50 and the 200-session EMA at $4.56.
- Hourly RSI14 at 85.7 and 15-minute RSI14 at 77.51 both sit in overbought territory.
- Price is testing the daily 20-session EMA at $1.73, a key short-term hurdle for the stock.
Daily Chart: Sono Group (SSM) Structure Still Fragile
The size of the intraday jump should not be read as a trend reversal just yet. The daily chart still shows Sono Group trading below its 50-session EMA at $2.50 and its 200-session EMA at $4.56. That longer-term structure remains bearish-leaning, even as today’s rally pushes the stock toward the 20-session EMA at $1.73.
On the daily chart, the session so far has ranged between $1.11 and $1.87, opening at $1.12. That wide intraday swing highlights how aggressively buyers have stepped in during the session.
Moving Average Structure Remains Bearish
The daily averages remain stacked in a bearish order. The 20-session EMA sits at $1.73, below the 50-session EMA at $2.50. The 200-session EMA sits further above at $4.56. Price is now testing the 20-session EMA, though it still has meaningful ground to cover before challenging the 50- and 200-session averages.
Momentum Indicators Signal Stabilization
Notably, the daily RSI14 reads 45.92, a neutral level that does not yet confirm a trend shift. It reflects a stock recovering from depressed levels without reaching overbought territory on this timeframe.
The daily MACD tells a similarly cautious story. Both the MACD line at -0.46 and the signal line at -0.48 remain below zero, keeping daily momentum negative. However, the histogram has turned slightly positive at 0.02. This means the line has just crossed above the signal — an early sign of stabilization rather than a confirmed reversal.
Bands and Pivot Levels in Context
The daily Bollinger setup places the mid band at $1.78, with the upper band at $3.20 and the lower band at $0.36. Price sits just below the mid band. Today’s spike has pulled the stock toward the center of its recent range without reaching overbought territory on this timeframe.
Daily ATR14 stands at $0.40, pointing to lively day-to-day swings for a stock trading near the $1.70 area. Meanwhile, the daily pivot from Wednesday’s candle sits at $1.13, with R1 at $1.15 and S1 at $1.09. Price has already moved well beyond both the pivot and R1, showing how far today’s intraday push has outrun the prior session’s levels.
Hourly Momentum: Overheated But Confirming the Breakout
Meanwhile, the hourly chart paints a different picture. Price at $1.74 sits above both the 20-hour EMA at $1.24 and the 50-hour EMA at $1.26. It remains below the 200-hour EMA at $2.05.
The hourly RSI14 is at 85.7, deep into overbought territory. That level typically signals buying pressure has become extended in the short run. It raises the odds of a pause within the hour-to-hour swings.
The hourly MACD line at 0.08 sits above its signal at 0.01, with the histogram at 0.06. This confirms positive short-term momentum, in contrast to the still-negative daily MACD.
Price is also trading above the hourly upper Bollinger band at $1.52. The mid band sits at $1.18 and the lower band at $0.83. Trading outside the upper band is consistent with a sharp, extended breakout rather than a steady grind higher.
The hourly pivot stands at $1.56, with R1 at $1.86 and S1 at $1.31. Price holds above the pivot but has not yet tested R1. That leaves $1.86 as the next short-term hurdle.
15-Minute Execution Context
On the 15-minute chart, price trades above all three moving averages. The 20-period EMA sits at $1.43, the 50-period at $1.27, and the 200-period at $1.30. This is a short-term structure more clearly aligned to the upside than either the hourly or daily picture.
The 15-minute RSI14 at 77.51 is also overbought, echoing the hourly reading. At the same time, the MACD line at 0.16 remains above its signal at 0.11. The positive histogram of 0.05 keeps short-term momentum intact for now.
The 15-minute pivot stands at $1.72, with R1 at $1.90 and S1 at $1.57. Price hovers just above the pivot. It now functions as the nearest short-term support for intraday traders watching this breakout.
Bullish Scenario
A bullish continuation would need price to hold above the daily 20-session EMA at $1.73. It would also need to clear the hourly R1 at $1.86 and the 15-minute R1 at $1.90. A push through those levels would open the door toward the daily Bollinger mid band at $1.78. Further out, the 50-session EMA at $2.50 would come into view.
A daily MACD histogram that keeps building on its current 0.02 reading would add weight to that case. It would suggest momentum is genuinely turning rather than just spiking intraday.
Bearish Scenario
On the other hand, the extreme overbought readings leave this move vulnerable to a sharp pullback. The hourly RSI sits at 85.7 and the 15-minute RSI at 77.51.
A failure to hold above the hourly pivot at $1.56 or the 15-minute pivot at $1.72 would be an early warning sign. In that case, price could retrace toward the daily pivot zone around $1.13 to $1.15. It could even fall toward the daily S1 at $1.09, levels that were in force before today’s spike.
The daily 50-session EMA at $2.50 and 200-session EMA at $4.56 remain well above current price. Therefore, the broader structure stays fragile unless follow-through in the coming sessions confirms a genuine trend change.
Overall Outlook
Overall, Sono Group’s sharp intraday advance highlights a clear timeframe conflict. Short-term momentum on the hourly and 15-minute charts is stretched and overbought. Meanwhile, the daily structure remains well below its longer-term averages.
That gap between a fragile daily trend and an overheated short-term bounce argues for caution around position sizing. The daily ATR runs at $0.40, and overbought readings appear on both the hourly and 15-minute charts. With volatility running high, the coming sessions should clarify whether buyers can sustain this advance or whether the daily trend reasserts itself.
FAQ
What are the key levels to watch for Sono Group (SSM) after today’s surge?
The daily 20-session EMA at $1.73 is the immediate test. On the upside, resistance sits at the hourly R1 of $1.86 and the 15-minute R1 at $1.90. On the downside, the hourly pivot at $1.56 and the 15-minute pivot at $1.72 serve as near-term support.
Are the technical indicators signaling a trend reversal for SSM?
Not yet. The daily RSI14 at 45.92 remains neutral, and the daily MACD remains below zero. However, the daily MACD histogram turned slightly positive at 0.02. This hints at early stabilization rather than a confirmed reversal.
How extended are the short-term momentum readings for SSM?
The hourly RSI14 sits at 85.7 and the 15-minute RSI14 at 77.51, both in overbought territory. These levels reflect intense intraday buying pressure and signal that the move is vulnerable to a short-term pullback.
Disclaimer: This article is for informational purposes only and does not constitute financial advice, an investment recommendation, or a solicitation to buy or sell any financial instrument or cryptocurrency. The analysis provided is not indicative of future results. Investing in crypto assets and financial markets carries a high risk of capital loss. Always do your own research (DYOR) and consult a qualified financial advisor before making any decision.
Article produced with the assistance of artificial intelligence and reviewed by the editorial team.