
Close Menu
Aspire Market Guides
  • Home
  • Alternative Investments
  • Cryptocurrency
  • Economics
  • Equity Investments
  • Mutual Funds
  • Real Estate
  • Trading
What's Hot

What is Bitcoin dominance? How to read the BTC.D chart

August 24, 2026

Bajaj Finserv Flexi Cap among top 5 flexicap mutual funds with highest mid and smallcap exposure in July 2026 – The Economic Times

August 24, 2026

Why FASB’s ‘cash equivalent’ proposal could accelerate stablecoin adoption

August 24, 2026
Facebook X (Twitter) Instagram
Trending:
  • What is Bitcoin dominance? How to read the BTC.D chart
  • Bajaj Finserv Flexi Cap among top 5 flexicap mutual funds with highest mid and smallcap exposure in July 2026 – The Economic Times
  • Why FASB’s ‘cash equivalent’ proposal could accelerate stablecoin adoption
  • Token economics: Why inference efficiency matters
  • 2026 NFT Tax Filing Guide for Creators and Collectors
  • Schott Pharma stock trades softer as Xetra price dips to EUR 23.00
  • The Term “State Capitalism” Wrongly Equates Freedom With Dictatorship
  • Ethereum Price Outlook: Can ETH Reach $2,700 After 30% Rally?
  • Nichols brothers grab another property in Scott’s Addition
  • Endurance Capital buys majority stake in West Midlands children’s care provider Forge Care
Monday, August 24
Facebook X (Twitter) Instagram
Aspire Market Guides
  • Home
  • Alternative Investments
  • Cryptocurrency
  • Economics
  • Equity Investments
  • Mutual Funds
  • Real Estate
  • Trading
Aspire Market Guides
Home»Economics»The Supply Chain | NIST
Economics

The Supply Chain | NIST

By CharlotteJune 23, 20263 Mins Read
Share
Facebook Twitter Pinterest Email Copy Link


Applied Economics in US Manufacturing
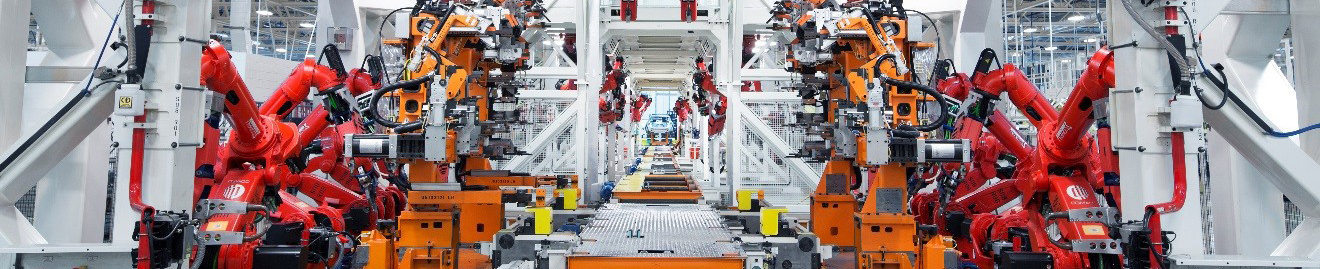
Assembly Plant

Photo Credit: The Chrysler 200 Factory Tour, an interactive online experience using Google Maps Business View technology, takes consumers inside the new 5-million-square-foot Sterling Heights Assembly Plant for a behind-the-scenes peek at how the 2015 Chrysler 200 is built.

Optimizing an industry supply chain and reducing losses due to disruption is likely to require advanced knowledge and understanding of supply chain operations. A number of AEO reports and articles characterize the U.S. supply chain.

The U.S. Supply Chain in Brief

  • U.S. Direct and Indirect manufacturing value added (i.e., manufacturing and its domestic supply chain) was $4.278 trillion in 2019 (NIST AMS 100-49).
  • In 2020, U.S. manufacturing imported 18.2 % of its intermediate goods/services supply chain (NIST AMS 100-49).
  • In 2020, 10.6 % of U.S. manufacturing output was of foreign origin (NIST AMS 100-49).
  • Frequently, an estimated 80 % of value added originates from 20 % of a supply chain (Thomas and Kandaswamy 2019).
  • Manufacturing shipments in 2020 were $5 221.3 billion, which can be broken into a number of supply chain costs:
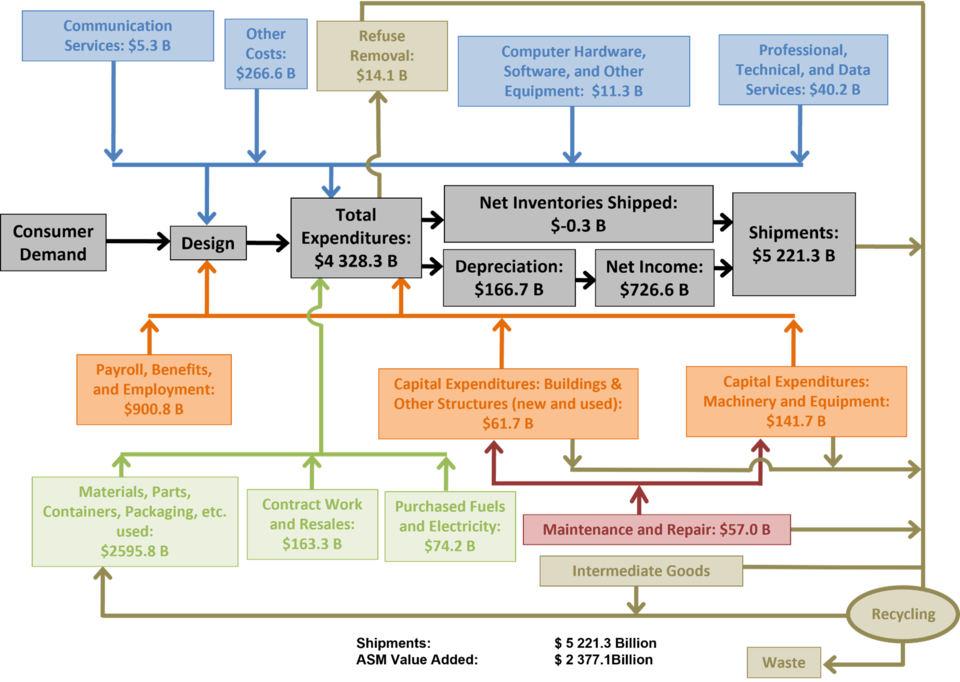
 

Fig31SupplyChain

Fig31SupplyChainKey


Figure 3.1 from NIST AMS 100-49: Manufacturing Supply Chain, 2020

Supply Chain Flow Time

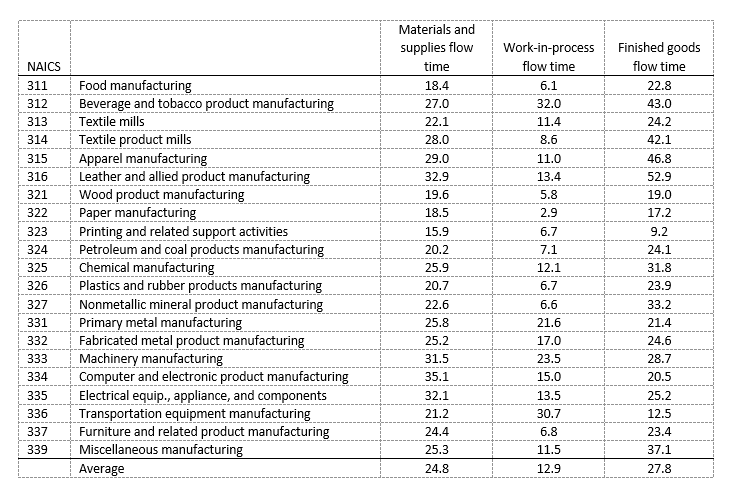
  • Supply chain flow time from raw material extraction to finished product can be months to years. The flow path for automobiles, for instance, is 794 days (NIST TN 1890).
  • On average, industry materials and supplies inventory flow, which is typically kept to address uncertainty in deliveries, is 24.8 days
  • On average, finished goods inventory flow, which is typically kept to address uncertainty in production and demand, is 27.8 days
Flowtime

Flow Time by Industry NAICS Code, Based on Methods from NIST TN 1890

Supply Chain Disruption Downstream

(Delays and shortages in supplies)

  • Manufacturing payroll is estimated to be suppressed by 2.9 % due to short-term downstream supply chain disruption from natural hazards (Thomas and Helgeson 2021)
  • Manufacturing GDP is estimated to be suppressed by 3.9 % due to short-term downstream disruption from natural hazards (Thomas and Helgeson 2021)
  • Manufacturing Employment is estimated to be suppressed by 8.6 % due to short-term downstream disruption from natural hazards (Thomas and Helgeson 2021)
  • The downstream supply chain effect of power disturbances is 2.3% of manufacturing value added (Thomas and Fung 2022).

MCG tool for Supply Chain Statistics

The Manufacturing Cost Guide (MCG) is a tool that estimates industry statistics for the manufacturing supply chain based on economic input-output analysis. It allows users to estimate value added for an industry and its supply chain. For example, a user could estimate the supply chain components of the automobile manufacturing, which would estimate the value added from all the other industries that is used by the automobile manufacturing industry.

AEO Supply Chain Pages

Optimizing supply chains and reducing disruption losses at the industry level is likely to require advanced knowledge and understanding of supply chain operations. It is often estimated that 80 % of a problem is due to 20 % of the cause and evidence suggests this 20 % can be a target rich environment for high return research investments. AEO supply chain research has three focus areas examining costs and losses in manufacturing:

Cost Mapping  |   Flow Time Mapping    |  Supply Chain Disruption


Source link

Related Posts

Economics

Token economics: Why inference efficiency matters

August 24, 2026
Economics

The Term “State Capitalism” Wrongly Equates Freedom With Dictatorship

August 24, 2026
Economics

Weekly links September 6: Lots of goodies that caught my eye while on August break

August 24, 2026
Economics

LCA of polymers (plastics) to improve circularity

August 24, 2026
Economics

News flash: We live in a mixed economy | Froma Harrop – auburnpub.com

August 24, 2026
Economics

Dr. Daniel Sutter: Socialism and government spending

August 24, 2026
Add A Comment
Leave A Reply Cancel Reply

Editors Picks

What is Bitcoin dominance? How to read the BTC.D chart

August 24, 2026

Bajaj Finserv Flexi Cap among top 5 flexicap mutual funds with highest mid and smallcap exposure in July 2026 – The Economic Times

August 24, 2026

Why FASB’s ‘cash equivalent’ proposal could accelerate stablecoin adoption

August 24, 2026

Token economics: Why inference efficiency matters

August 24, 2026
SUBSCRIBE TO OUR NEWSLETTER

Get our latest downloads and information first. Complete the form below to subscribe to our weekly newsletter.


I consent to being contacted via telephone and/or email and I consent to my data being stored in accordance with European GDPR regulations and agree to the terms of use and privacy policy.

Featured

Top Russian economist replaced after warning of economic costs of Ukraine war

August 17, 2026

Myer Holdings Reports $4.09 Billion FY26 Sales Amid Macroeconomic Headwinds and Consumer Caution

July 26, 2026

Ukraine drones hit Tuapse refinery, port infrastructure – Quantum Commodity Intelligence

April 16, 2026
Monthly Featured

Raiders Rumors Heating Up: Trades, Injuries, Position Fights

July 5, 2026

How Utility, Token Economics, and Developer Growth Affect the Solana Price

June 19, 2026

Apotex soars as private equity firm builds on legacy of founder Barry Sherman

June 11, 2026
Latest Posts

What is Bitcoin dominance? How to read the BTC.D chart

August 24, 2026

Bajaj Finserv Flexi Cap among top 5 flexicap mutual funds with highest mid and smallcap exposure in July 2026 – The Economic Times

August 24, 2026

Why FASB’s ‘cash equivalent’ proposal could accelerate stablecoin adoption

August 24, 2026
SUBSCRIBE TO OUR NEWSLETTER

Get our latest downloads and information first. Complete the form below to subscribe to our weekly newsletter.


I consent to being contacted via telephone and/or email and I consent to my data being stored in accordance with European GDPR regulations and agree to the terms of use and privacy policy.

© 2026 Aspire Market Guides.
  • Contact us
  • Privacy Policy
  • Terms and Conditions

Type above and press Enter to search. Press Esc to cancel.

SUBSCRIBE TO OUR NEWSLETTER

Get our latest downloads and information first.

Complete the form below to subscribe to our weekly newsletter.


I consent to being contacted via telephone and/or email and I consent to my data being stored in accordance with European GDPR regulations and agree to the terms of use and privacy policy.