

Quick overview
- Global commodity derivatives markets are undergoing significant restructuring, leading to price decompression in alternative hard assets like silver.
- Spot silver prices have stabilized at $57.45 per troy ounce after a morning decline, influenced by the easing of geopolitical tensions from the U.S.-Iran Interim Peace Treaty.
- The U.S. Federal Reserve’s strict monetary policy has raised capital costs, impacting paper commodity futures and leading to unwinding of leveraged holdings.
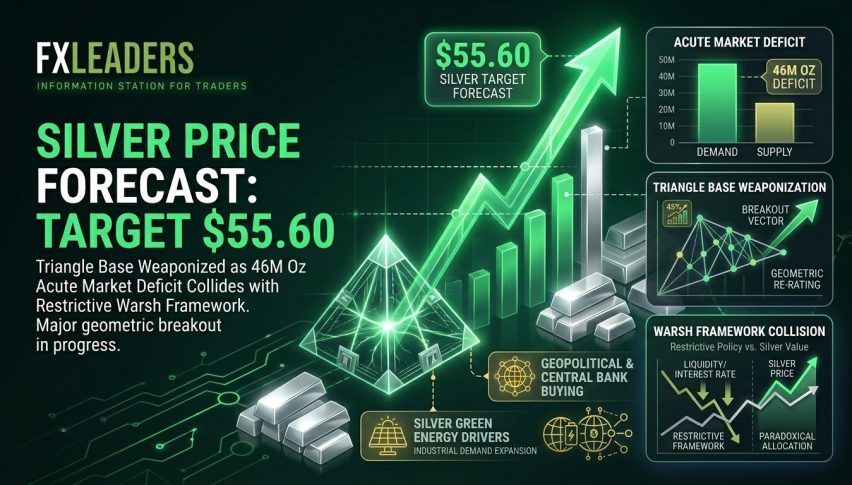
- Despite a structural supply deficit of 46.3 million troy ounces in the silver market, short-term price movements remain vulnerable to a potential technical rebound.
Global commodity derivatives markets are in the midst of a brutal restructuring, putting pressure on alternative hard assets to undergo severe near-term price decompression. On Tuesday, June 30, 2026, spot silver (XAG/USD) fell throughout the morning trading session before stabilizing somewhat at the current quote of $57.45 per troy ounce, a slight advance of +0.38% from recent session lows. Select industrial procurement networks and long-term asset allocation pools are stepping in with highly regimented block orders within specific price ranges in an effort to build support as speculative momentum positions are being liquidated as part of the monthly rollover process.
Islamabad MOU Eases Oil Price Premiums and De-Risks Safe Havens
The principal fundamental catalyst behind today’s sell-side weakness in the precious metals complex is the growing global operational implementation of the U.S.-Iran Interim Peace Treaty also known as the “Islamabad Memorandum of Understanding.” Ever since the bilateral, international agreement was formally ratified at a cross-border ceremony in Switzerland on June 19, maritime shipping lanes through the vital Strait of Hormuz have eased, with the volume of cargo ships transiting the region now back to 85% of normal seasonal levels.
This recent decline in near-term Brent crude crude oil benchmarking below $73 per barrel has now forced the rapid unwind of the acute, panic-driven war premium that was underwriting paper commodity futures throughout the first half of Q2. While this geopolitical stabilization is causing a short-term pullback in safe-haven precious metals flows, the resulting global decline in energy inputs to the industrial economy is providing meaningful financial relief for manufacturing centers across Asia and Europe.
The Warsh Doctrine Hardens U.S. Capital Carrying Costs
The last major obstacle in any significant, multi-day rally in non-yielding assets was the extremely restrictive domestic monetary policy implemented during the June 16, 17 FOMC Federal Open Market Committee policy meeting which marks the first-ever monetary policy debut of Federal Reserve Chair Kevin Warsh. Amidst stubborn underlying consumer price inflation data, with sticky core CPI reading at 4.1% on the previous reporting month, Chair Warsh enforced a strict, data-driven monetarist strategy, eliminating all prior dovish forward guidance as well as a market expectation of rate cuts this autumn.
In response, the Warsh Fed has been holding benchmark interest rates near their cyclical highs, pushing real U.S. Treasury yields and the U.S. Dollar Index (DXY) to fresh near-term multi-month cycle highs, as evidenced by a higher-than-expected June 18 “dot plot” projection on the Summary of Economic Projections (SEP). The resulting high cost of capital has created a heavy carrying cost for paper derivatives and forced investors to continue unwinding leveraged holdings within major asset allocation indices while the physical marketplace continues to await the next wave of manufacturing PMI data later in the calendar quarter.
Six-Year Physical Deficit Puts Pressure on Solar Panel Efficiency
This wide gap between short-term paper liquidations and longer-term physical supply availability remains the central structural underpinning of the current silver commodity complex. Per the Silver Institute’s updated global survey data for 2026, the physical silver market is currently in its sixth consecutive year of a structural supply shortfall, now projected to see a net deficit of 46.3 million troy ounces for the full year of 2026. And because almost 72% of global silver mine production is derived from the secondary processing of copper, zinc, and lead concentrate byproducts, the miners are incapable of increasing production in order to take advantage of near-term pricing anomalies. Meanwhile, industrial fabrication demand continues to remain strong in key high-intensity sectors such as high-end CPU computing arrays, artificial intelligence data centers, and 5G networking infrastructure.
However, paper commodity futures traders are also closely watching for regional demand destruction in select industrial markets, where it is believed that higher spot silver prints earlier this year have led to a year-over-year 19% decline in total solar photovoltaic silver intensity. This industrial material optimization and substitution has temporarily slowed commercial silver buying activity, creating a favorable operating environment for macro bears to force spot prices lower into deep discount price levels.
Technical Analysis: XAGUSD Tests 2-Hour Descending Triangle Pattern in Deeply Over-Sold Territory
Shifting to silver’s hourly technical chart from the previous central bank “dot plot” analysis, the recent sustained downward correction in spot price action has pushed XAG/USD lower into the lower levels of a large-scale price pattern with significant historical trade volume.
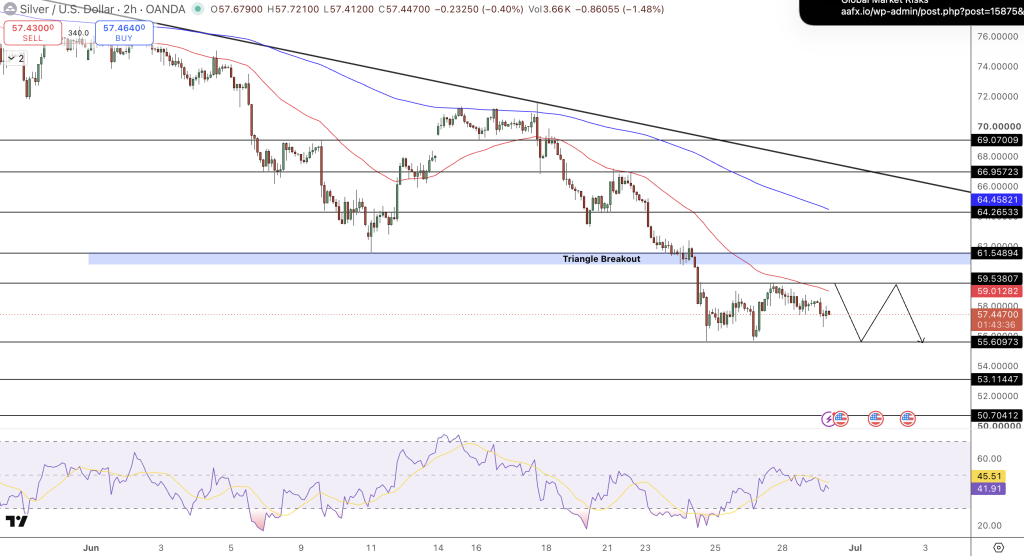
The XAG/USD currency pair is currently trading near the lower boundaries of a prominent descending triangle price pattern since the recent cyclical highs earlier in 2026. Price action is currently hovering just under the lower level of this pattern at $57.45 and has fallen well below its recent, moving average 2H Exponential Moving Average 200 period (EMA200) at $65.89.
The 14-period relative strength index is now coming back toward neutral levels at 41.91, suggesting that short-term selling pressure has completed the bulk of its down leg and reset the oscillator to normal market conditions. The technical flattening of the moving average convergence divergence (MACD) lines is also occurring, pointing to a very condensed market structure preparing for a near-term technical rebound from oversold levels.
Conclusion and Trade Strategy
Silver continues to undergo an aggressive, short-term re-pricing as geopolitical market premiums from the U.S.-Iran ceasefire fade out and the new Federal Reserve structure maintains high global capital carrying costs. However, the enduring reality of a structural 46.3 million troy ounce physical supply deficit and an extremely compressed 2-hour technical price structure suggests silver will remain vulnerable to a near-term short-covering rally in price.
Tactical Rebound Strategy
Initiate long positions as soon as 2-hour price action closes above the $55.61 lower line support of the descending triangle pattern. Place a protective stop-loss order just below the horizontal structural support level at $53.11 and target a near-term technical short-covering rally to the descending triangle pattern’s upper ceiling at $59.06, with an initial secondary target of $61.55.
Arslan Butt
Lead Markets Analyst – Multi-Asset (FX, Commodities, Crypto)
Arslan Butt serves as the Lead Commodities and Indices Analyst, bringing a wealth of expertise to the field. With an MBA in Behavioral Finance and active progress towards a Ph.D., Arslan possesses a deep understanding of market dynamics.
His professional journey includes a significant role as a senior analyst at a leading brokerage firm, complementing his extensive experience as a market analyst and day trader. Adept in educating others, Arslan has a commendable track record as an instructor and public speaker.
His incisive analyses, particularly within the realms of cryptocurrency and forex markets, are showcased across esteemed financial publications such as ForexCrunch, InsideBitcoins, and EconomyWatch, solidifying his reputation in the financial community.