
Here is my weekly stock market outlook for the week of July 20, 2026. It helps me determine whether I’ll place new trades during the week, gives me a sense of market health, and shows me how much or how little of my capital I want to deploy.
Conditions DO change during the week, and as they do, so does the outlook. This is why each week I discuss what I like and don’t like. I monitor market health daily, and you should too, even though this article is updated once weekly.
The stock market outlook is based on:
- how the major indices are performing
- “Market Health Indicators”
- recent watchlist and trade performance
- sector performance
My swing trading is based on: Overall market conditions (discussed below) –> strong/weak individual stocks for longs or shorts –> patterns –> trade triggers.
Stock Market Outlook for This Week
For the week of July 20:
- Conditions are mixed. Will consider allocating some capital to longs.
Here are the current stock watchlists:
The Trading Fix Book is now available. If you’re tired of FOMO, revenge trading, early exits, impulsive entries, or second-guessing your strategy, this book is your solution. Fix the behaviors that sabotage your trading—and finally trade with clarity, confidence, and consistency.
How the Market Indexes Are Doing
I look at four different US indices because each tells a different story about the overall health of the stock market. The stock market is healthiest—and swing trading stocks on the long side is most profitable—when all these indexes are in uptrends. Here’s what each of the four indices represents:
- Nasdaq 100 – Tech stocks
- S&P 500 – Large US companies
- NYSE Composite – A wide array of stocks, varying in size and industry
- Russell 2000 – Smaller companies
The Canadian index tracks large-cap Canadian stocks.
Charts provided by TradingView, the charts I use (use the link to save $15 on packages).

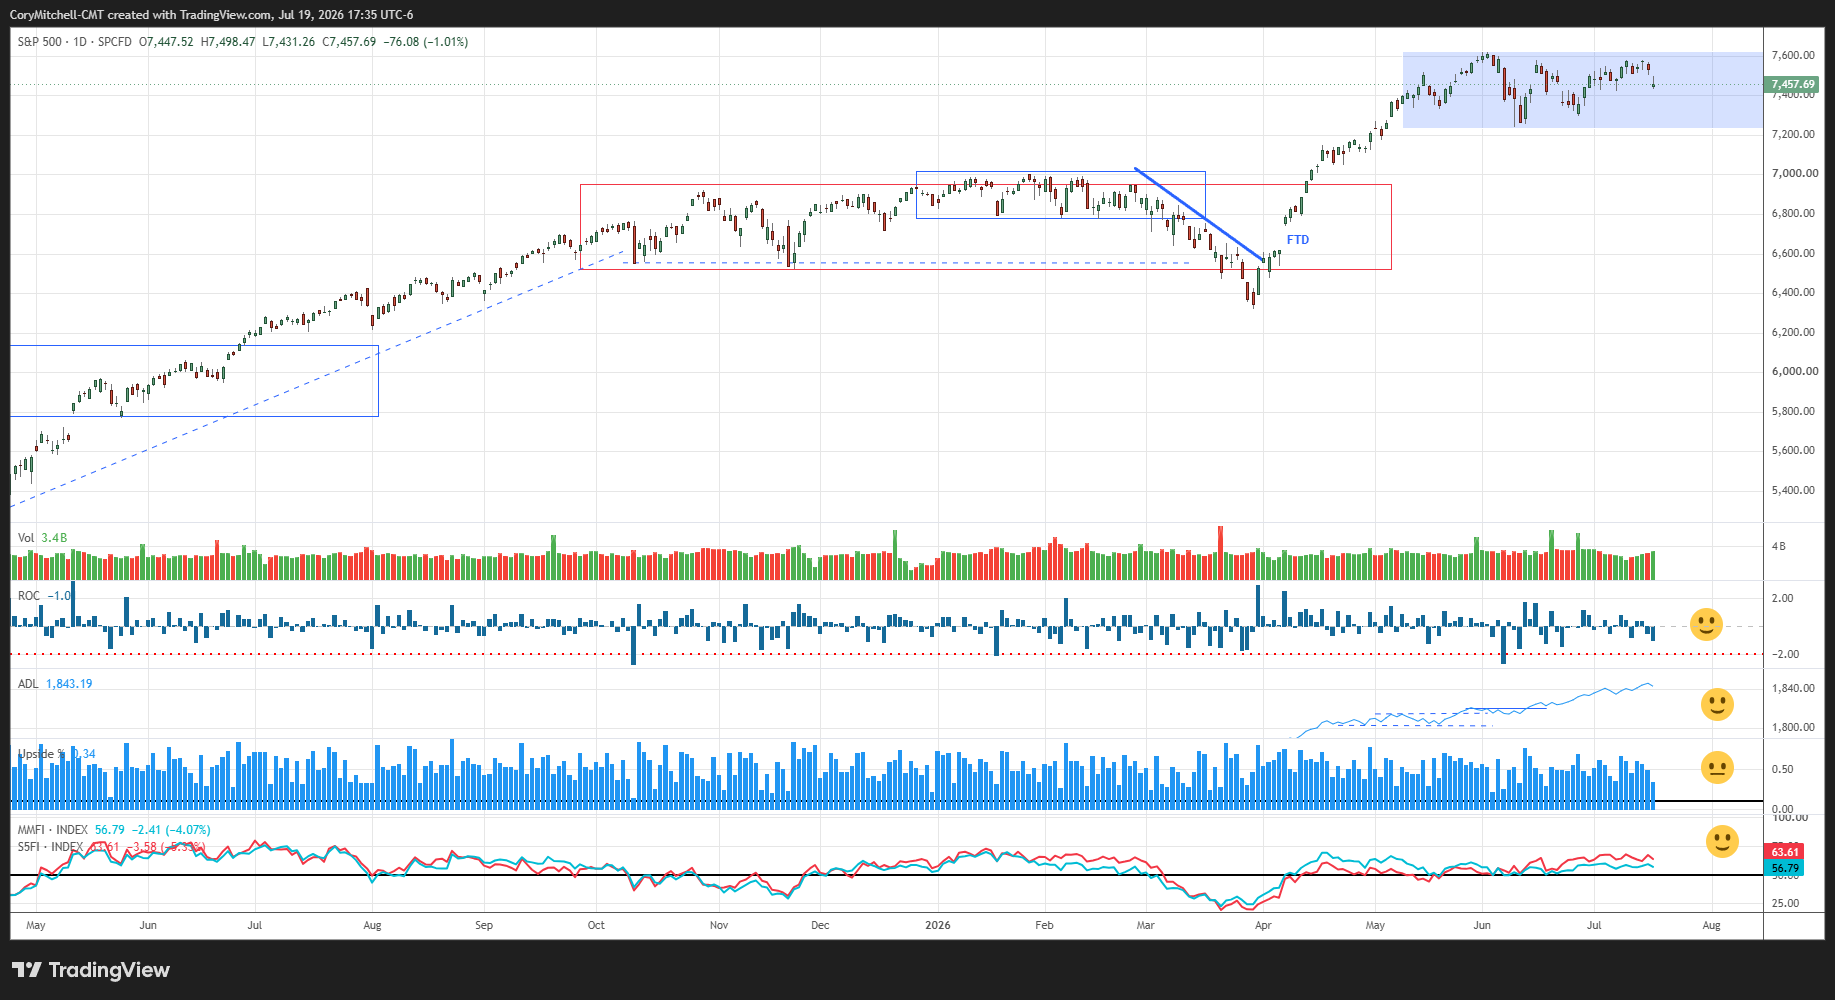
From a price action perspective, all the indices have been choppier recently. It isn’t bearish, but it isn’t exactly easy conditions either. I will consider allocating some capital to longs, but not loading up. Haven’t been seeing much anyway.
As for Bitcoin, it has dropped to the bottom of its prior range. Support has held so far. I need to see more uptrending behavior before getting involved.
State of the Market Health Indicators
The following chart shows the market health indicators I track.
They tell me the condition of the stock market overall and whether it’s a good time to swing trade individual stocks.

Market Health Indicators are good.
- Volume not currently relevant to me.
- The dark blue bars show the daily percentage change in the S&P 500. Big moves to the downside are associated with downtrends and turning points. Uptrends are correlated with small daily movement. No big drops recently. Good.
- The blue line is the cumulative NYSE Advance-Decline Line. It has moved strongly to new highs while the S&P 500 is below its highs/flat. A positive divergence. Good.
- The blue columns are the NYSE up-volume divided by the NYSE total volume. Values of 90 or higher show very strong buying; values of 10 or below show very strong selling. Nothing recent. Neutral
- 64% of S&P 500 stocks are above their 50-day moving average. 57% of all US stocks are above their 50-day moving average. It’s generally much easier to swing trade profitably (on the long side) when most stocks are above their 50-day average. When this indicator is below 50%, it tends to be sideways or a downtrend for most stocks/indexes. Good.
- The ultimate indicator is how many quality setups there are and how trades are working. You can look at your recent results and watchlists to determine whether this is an easy-money environment or hard on the short and/or long side.
The Complete Method Stock Swing Trading Course covers my entire stock swing trading method.
Sectors and Hot Industries
The sector performance chart from Chartmill shows which sectors have been strong recently, as well as over the month and three months.

The article, How to Scan for the Strongest Stocks in the Strongest Sectors, covers how to find high-momentum stocks by looking at sector performance in Finviz, StockRover, StockFetcher, or StockCharts. It also shows you how to determine when money is flowing into or out of a sector.
There are times when market conditions may not be so good, but certain INDUSTRIES are really performing well. For example, gold or oil stocks may be rallying hard while the major indices are flat or declining. Or Semiconductors may be hot while the indices are flat.
It is possible to trade in these “hot” sectors even when market conditions may not be ideal… just realize that nothing can fight the market for long. Either the market starts moving up, or eventually the hype around hot stocks ends and they come down. With such trades, we are often on borrowed time, so I am more inclined to use trailing stop losses to avoid giving back all the profits if the target isn’t reached. Basically, take what you can get. Consider how much capital you are willing to deploy in such situations. That is a personal choice.
What I’m Doing Right Now
Will consider some long trades as long as conditions stay OK. But overall, not seeing much. Will utilize more capital if things continue to improve, or less/none if they deteriorate.
Don’t want to have to analyze market conditions and pick individual stocks to trade? You can also passively invest. In my “long-term account,” I buy the same ETFs every month, regardless of market conditions. Buy and hold. Simple. It doesn’t make as much as swing trading or day trading, but it is much less work.
By Cory Mitchell, CMT
Disclaimer: Nothing in this article is personal investment advice, or advice to buy or sell anything. Trading is risky and can result in substantial losses, even more than the deposited amount if using leverage.