

A bearish tone is increasingly visible on both gold and silver charts heading into the FOMC meeting, as markets continue to reprice inflation risks and interest rate expectations.
The Bank of Japan meeting earlier today reflected a cautious hold and a hawkish tilt, and a similar tone is expected from Powell, as markets also begin to price uncertainty around future Fed leadership.
Source: Trading view
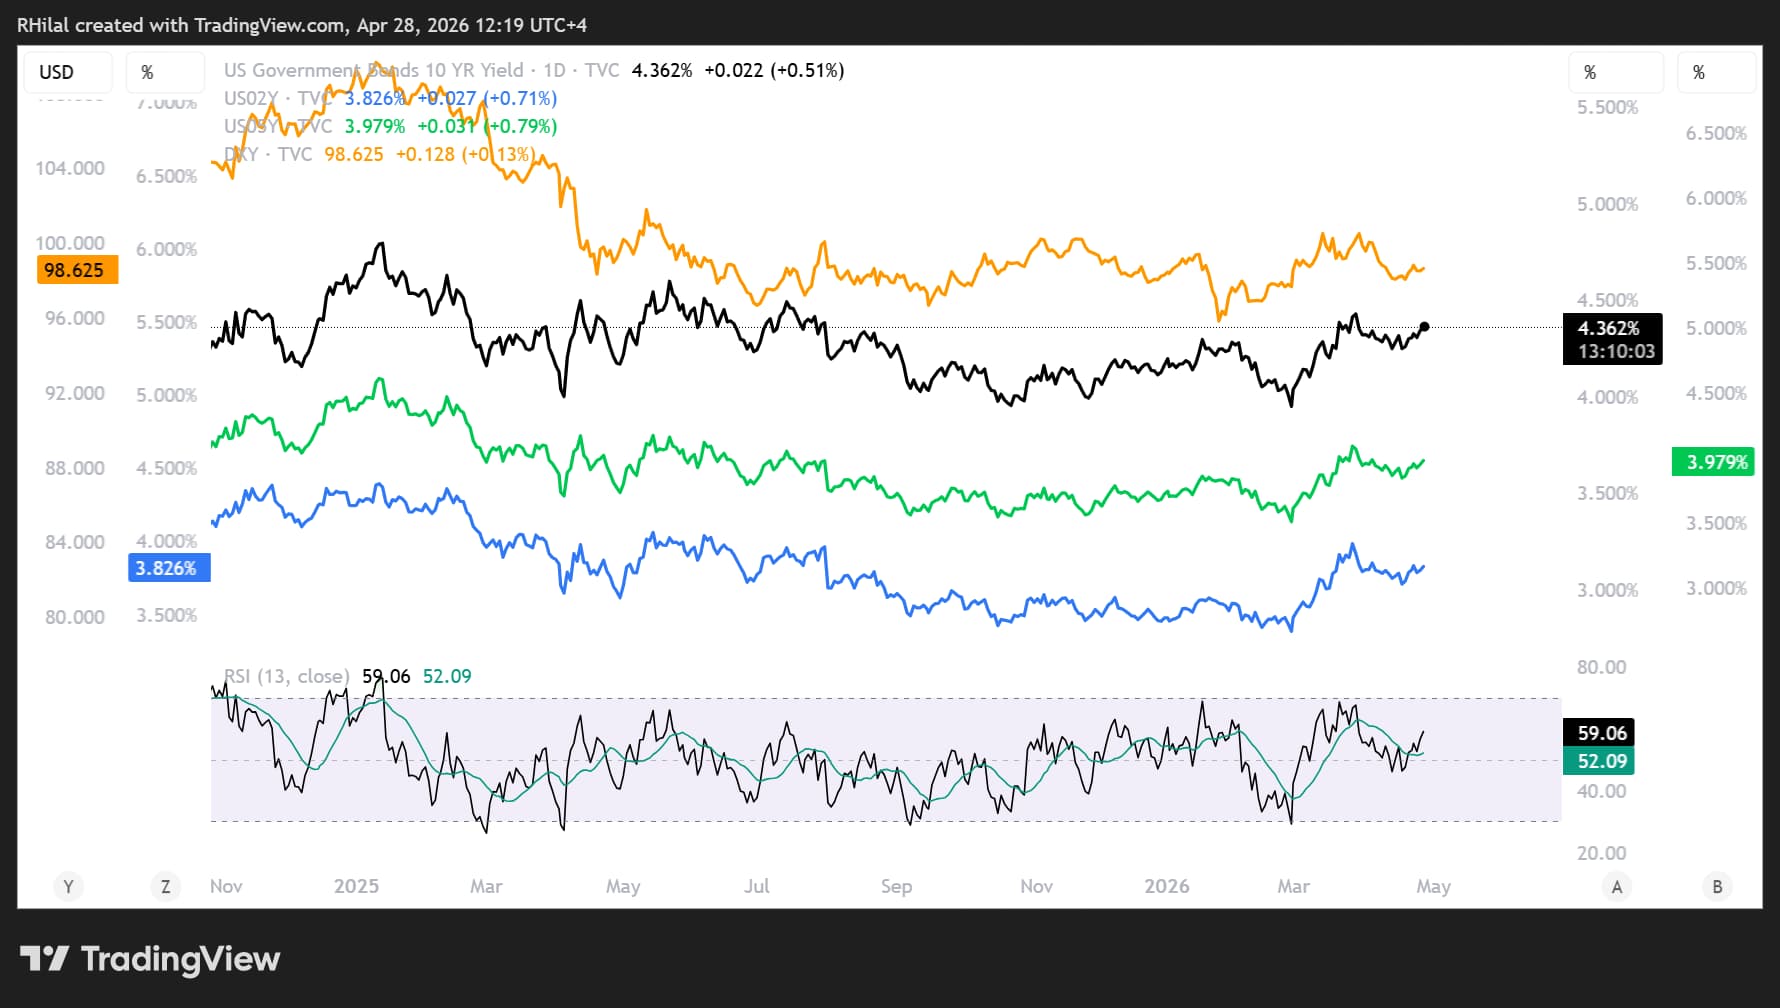
Following the Strait of Hormuz closure on February 28, 2026, inflation pressures have rippled across global markets through energy, logistics, and fertilizer costs, pushing US CPI toward 3.3%. Now in the second month of this disruption—one of the most significant energy shocks in modern history—markets are seeing continued support for US yields and the dollar ahead of Wednesday’s FOMC meeting.
This dynamic, elevated yields combined with dollar strength, continues to act as a key headwind for gold and silver, reinforcing the bearish bias in price action and keeping both metals under pressure near critical technical levels, echoing the March 2026 set up.
Gold Price Outlook: Daily Time Frame – Log Scale
Source: Trading view
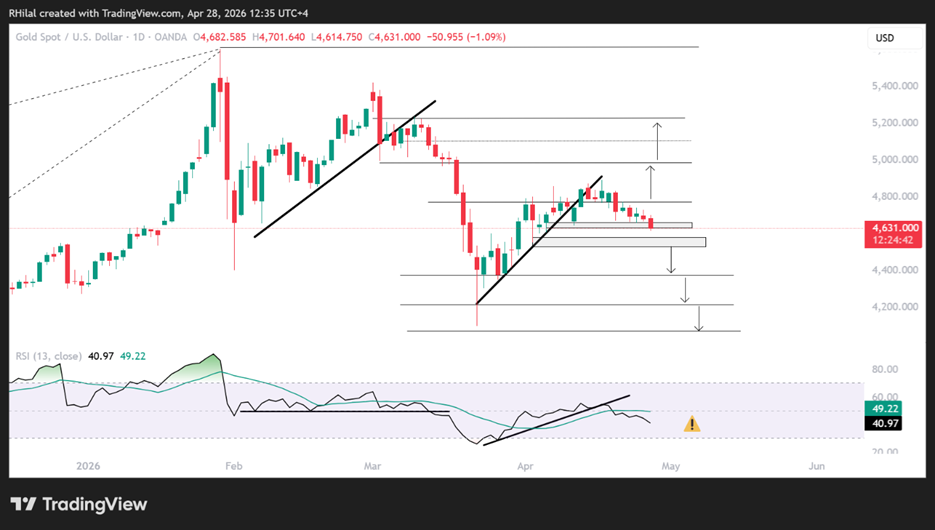
On the daily chart, gold is consolidating below the trendline connecting higher lows since March 2026 (originating near the 4,080 level), and below the 4,880 resistance. This structure has held since mid-April, mentioned in my previous articles: Gold, Silver Price Outlook: Caution Builds Below $4880 and $84 reflecting a setup similar to the March drawdown, with momentum slipping below neutral and key support levels coming into focus.
Bullish scenario
A close above 4,780 and 4,880 would open the path toward 4,980, where initial pullback risks may emerge. These levels align with the 0.618 and 0.786 Fibonacci retracement levels of the March 2026 decline.
A sustained move above 4,980 would reinforce the longer-term outlook toward 5,250, a key barrier before a potential extension toward the 5,600–6,000 range or a new consolidation phase.
Bearish scenario (higher probability as of April 28, 2026)
A close below the 4,630 support would extend short-term downside risks toward the 4,580–4,530 zone, aligning with the 0.236 Fibonacci extension of the March 2026 range.
Further downside levels align with key Fibonacci retracements:
- 4,380 (38.2%)
- 4,220 (50%)
- 4,070 (61.8%)
The 4,070 level is particularly critical, both technically and structurally, as it may either trigger a reversal or open the door to a deeper drawdown toward 3,840, 3,560, and 3,200, aligning with the 78.6%, 100%, and 127% extensions.
This scenario would likely coincide with a move in silver toward the $48 area.
Silver Price Outlook: Daily Time Frame – Log Scale
Source: Trading view
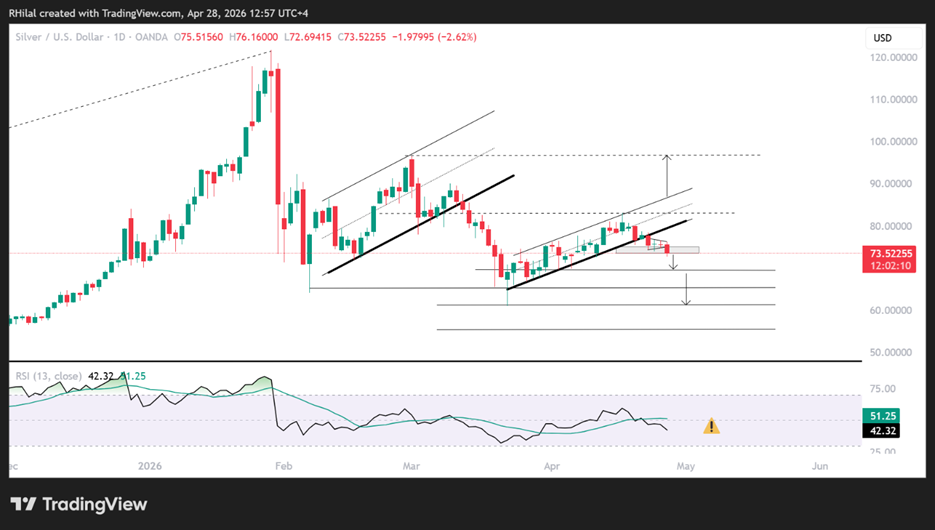
On the daily chart, silver is showing a structure similar to gold’s March 2026 pattern, with price action reflecting a bearish breakout from the parallel channel followed by a rebound.
Bullish scenario
A close above 80 and 84, bringing price action back within the channel, would open the path toward 86 and 96, before a potential extension toward the 120 level, where pullback risks may re-emerge.
These levels align with the 0.382, 0.5, and 0.618 Fibonacci extensions of the April 2025 – January 2026 – March 2026 trend.
A sustained move above 120 would reinforce the longer-term outlook toward 200.
Bearish scenario (higher probability as of April 28, 2026)
A close below 73.50 would extend downside risks toward 69.50, 65.30, and the 61.30 low. At these levels, silver may either stage a rebound or extend lower toward 55 and 48.
The 48 level is particularly notable, aligning with a multi-decade resistance zone dating back to the 1990 highs, potentially offering a long-term accumulation opportunity—consistent with gold’s bearish scenario.
Key Takeaway
Long-term levels remain critical in distinguishing structural shifts from headline-driven volatility, especially in the context of US–Iran negotiations, FOMC expectations, central bank outlooks, and ongoing developments surrounding the Strait of Hormuz.
Written by Razan Hilal, CMT
Follow on X: @Rh_waves