

The euro area economy has been more resilient to the effects of the conflict in the Middle East than previously expected. Real GDP growth surprised on the upside in the second quarter of 2026 and short-term indicators point to robust growth in the near term as uncertainty recedes, confidence improves and the energy supply shock stemming from the Middle East conflict is assumed to gradually ease.[1] The summer heatwave in Europe is expected to have had only a limited and temporary negative impact on economic activity. Over the medium term, domestic demand should continue to be supported by a recovery in real incomes, driven by lower energy inflation, as well as a resilient labour market, with the unemployment rate expected to reach new historical lows. Rising government spending on infrastructure and defence, especially in Germany, complemented by investments related to artificial intelligence (AI), should also support growth in the later years of the projection horizon. On the external side, export growth should pick up on the back of strengthening foreign demand, although persistent competitiveness challenges will continue to weigh on exports. Moreover, the euro area is expected to benefit less than some other economies from strong global AI-related demand, reflecting the smaller size of its AI goods sector. The baseline projections foresee annual real GDP growth of 0.9% in 2026, 1.4% in 2027 and 1.5% in 2028 (Table 1). Adjusting for volatility in Irish data, growth is expected to be 1.2% in 2026 and 2027, and then to rise to 1.4% in 2028.[2] Compared with the June 2026 projections, GDP growth has been revised up by 0.1 percentage points for 2026 (0.3 percentage points when adjusting for volatility in Irish data). This reflects data surprises and positive survey indicators which imply a carry-over effect in 2027, leading to a 0.2 percentage point revision for that year. For 2028, GDP growth is unrevised.
The outlook for inflation continues to be shaped largely by the energy shock, which is assumed to dissipate, although there is high uncertainty surrounding this assumption. Inflation is expected to peak at 3.6% in the fourth quarter of 2026 owing to the surge in energy prices resulting from the Middle East conflict, with increases in crude oil prices being amplified by additional upward pressures on the prices of refined oil products and on wholesale gas and electricity prices. As the main impact of the conflict on energy prices drops out of the year-on-year comparison, headline inflation, as measured by the Harmonised Index of Consumer Prices (HICP), is expected to fall to 2.5% in the second quarter of 2027 and to hover close to 2.0% thereafter. The profile of headline inflation masks differences in the speed at which the energy shock is transmitted across the main components. A fast pass-through to consumer energy prices implies that energy inflation would quickly follow the assumed decreases in energy commodity prices, turning negative in the course of 2027, and then increasing in 2028 with the introduction of the EU Emissions Trading System 2 (ETS2). By contrast, the energy shock is expected to feed through only gradually to non-energy inflation, which is expected to rise until early 2027 and then to stay elevated before moderating again in 2028. Overall, indirect and second-round effects are assessed to be contained. The expected easing of inflation is seen to help to contain wage pressures over the medium term in the context of the improving outlook for the economy and for the labour market, although wage growth is expected to remain above its long-term average level. Overall, the baseline projections foresee HICP inflation picking up from 2.1% in 2025 to 3.0% in 2026 and then declining to 2.5% in 2027 and falling further to 2.1% in 2028. The outlook for headline HICP inflation in 2026 is unrevised, with downward revisions to the food component following significant downward surprises up to July, and notwithstanding some upward pressure from the effects of adverse weather, offsetting upward revisions to energy inflation. Headline inflation has been revised up by 0.2 percentage points for 2027 and by 0.1 percentage points for 2028, reflecting expected higher energy inflation in 2027 and stronger core inflation (i.e. HICP inflation excluding energy and food) in both years, driven by the better outlook for economic activity and somewhat higher wage growth amid a slight improvement in the labour market. The strength of indirect and second-round effects is expected to be broadly unchanged compared with the June 2026 projections, with the exception of lower indirect effects on food prices.
The economic outlook for the euro area remains highly uncertain amid the ongoing conflict in the Middle East, the blockade of the Strait of Hormuz and continued volatility in energy prices. To illustrate this uncertainty, the baseline projections are complemented by updated versions of the three alternative scenarios contained in the June 2026 projections – a milder scenario, an adverse scenario and a severe scenario. These scenarios differ in terms of their assumptions regarding the magnitude and persistence of the Middle East conflict and the energy price shock, and the impact of the shock on the international environment and on uncertainty, as well as the strength of indirect and second-round effects on inflation.
- The milder scenario assumes that energy prices would normalise more rapidly than in the baseline. As a result, inflation would moderate more quickly, undershooting the 2% inflation target in 2027 and 2028, while GDP growth would be slightly stronger than in the baseline.
- The adverse scenario assumes a sharper and more persistent increase in energy prices than in the baseline. It also incorporates higher uncertainty and larger international spillovers, as well as stronger indirect and second-round effects on inflation. Relative to the baseline, it implies higher inflation in 2026–28, while GDP growth would be lower than in the baseline in 2027 and 2028.
- The severe scenario assumes a stronger and more persistent energy price shock, greater uncertainty and a stronger reaction of wages and non-energy prices than in the adverse scenario. Relative to the baseline, it entails significantly and persistently higher headline inflation across the projection horizon, consistent with past experience of non-linearities in the face of a large energy price shock. GDP growth would weaken markedly in 2027, before rebounding to stand only slightly below the rate projected in the baseline in 2028, as stronger wage growth would support income and demand.
Table 1
Growth and inflation projections for the euro area
(annual percentage changes)
|
|
|
June 2026 baseline |
September 2026 – baseline and alternative scenarios |
|||
|---|---|---|---|---|---|---|
|
Baseline |
Milder scenario |
Adverse scenario |
Severe scenario |
|||
|
Real GDP |
2025 |
1.5 |
1.3 |
|||
|
2026 |
0.8 |
0.9 |
0.9 |
0.9 |
0.8 |
|
|
2027 |
1.2 |
1.4 |
1.5 |
1.1 |
0.4 |
|
|
2028 |
1.5 |
1.5 |
1.6 |
1.4 |
1.4 |
|
|
HICP |
2025 |
2.1 |
2.1 |
|||
|
2026 |
3.0 |
3.0 |
2.9 |
3.1 |
3.3 |
|
|
2027 |
2.3 |
2.5 |
1.9 |
3.2 |
5.4 |
|
|
2028 |
2.0 |
2.1 |
1.8 |
2.3 |
3.2 |
|
|
HICP excluding energy and food |
2025 |
2.4 |
2.4 |
|||
|
2026 |
2.5 |
2.5 |
2.5 |
2.5 |
2.5 |
|
|
2027 |
2.5 |
2.6 |
2.5 |
2.8 |
3.5 |
|
|
2028 |
2.2 |
2.3 |
2.2 |
2.4 |
3.2 |
|
Notes: Real GDP figures refer to annual averages of seasonally and working day-adjusted data. Euro area GDP data are affected by significant volatility related to the activities of multinational enterprises in Ireland. A measure of euro area GDP using modified domestic demand instead of GDP for Ireland would lead to a growth outlook of 1.2% for 2026 and 2027 and 1.4% for 2028. This compares with a path of 0.9% for 2026, 1.1% for 2027 and 1.5% for 2028 in the June 2026 staff projections. See footnote 4 for more details. Historical data may differ from the latest Eurostat publications owing to data releases after the cut-off date for the projections.
2.1 Real economy
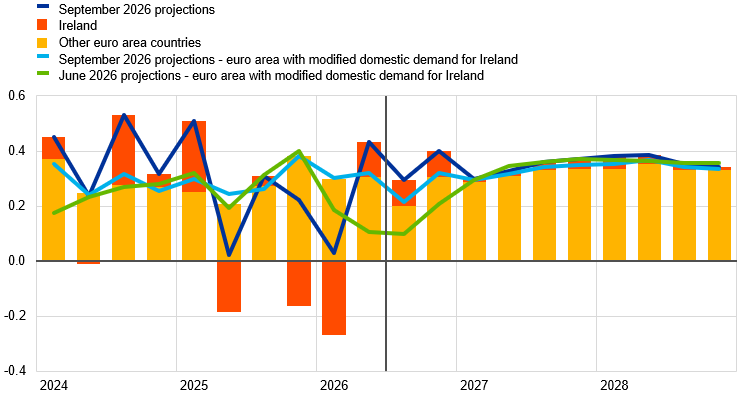
The euro area economy has remained resilient in the face of the energy and uncertainty shocks related to the Middle East conflict. According to Eurostat’s flash estimate, real GDP rose by 0.4% in the second quarter of 2026, from 0.0% in the first quarter.[3] An adjusted measure of euro area GDP that uses modified domestic demand instead of GDP for Ireland rose by 0.3% in the same period, which is 0.2 percentage points above the June projections and unchanged from the first quarter of 2026 (Chart 1, panel a).[4] The upward surprise suggests that the adverse real income and uncertainty effects from the Middle East conflict have remained contained while a positive impulse from the ongoing AI boom may have supported business investment and external demand.
Available survey data point to strengthening confidence and growth momentum, despite ongoing uncertainty related to the Middle East conflict and a temporary drag from extreme summer weather in Europe. Survey data up to August point to improving growth momentum since the troughs reached in the spring. The composite output Purchasing Managers’ Index (PMI) edged up in August, driven by strengthening dynamics in manufacturing output, with the services PMI remaining in growth territory. Forward-looking PMI indicators also improved, although suppliers’ delivery times lengthened slightly. Similarly, the European Commission’s Economic Sentiment Indicator rose further in August, closing the gap with its February (pre-war) level. By contrast, the recent heatwaves and droughts in Europe – causing low water levels in key rivers, and wildfires – are expected to dent growth in the third quarter. Overall, using the adjusted measure, euro area growth is projected to slow to 0.2% in the third quarter, from 0.3% in the second quarter, before returning to 0.3% in the fourth quarter.[5] This implies upward revisions of 0.1 percentage points for the third and fourth quarters compared with the June projections, reflecting upward revisions in all demand components.
Chart 1
Euro area real GDP
a) Real GDP growth
(quarter-on-quarter percentage changes and percentage point contributions, seasonally and working day-adjusted quarterly data)
b) Real GDP levels
(index, Q1 2024 = 100)
Notes: Historical data may differ from the latest Eurostat publications owing to data releases after the cut-off date for the projections. The vertical lines indicate the start of the current projection horizon. In panel a), the red bars refer to the impact of Irish real GDP growth on the euro area aggregate and the yellow bars refer to growth in the other euro area countries.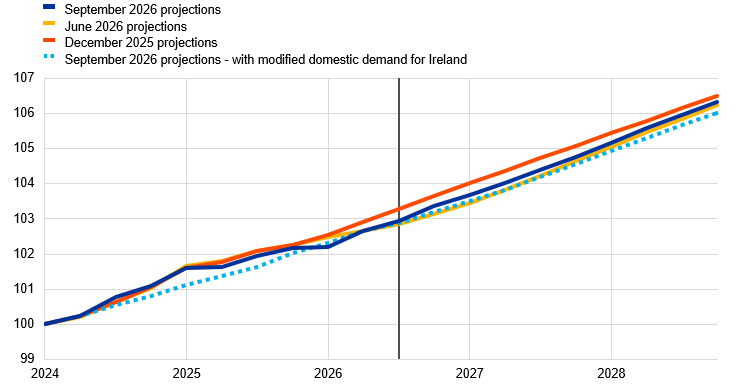
Over the medium term, real GDP growth is projected to increase steadily, as uncertainty is receding, confidence is improving and energy prices are normalising. Private consumption is projected to be the largest contributor to growth in the medium term, followed by robust investment dynamics (Chart 2). The contribution of net exports is projected to turn slightly positive from 2027.
- Private consumption growth is expected to remain moderate in the short term, owing to some losses in purchasing power and higher uncertainty, but should strengthen in the medium term. Private consumption is likely to grow at a moderate pace in the near term, owing to the dampening impact of the Middle East conflict on real disposable income, although this is seen to be partly cushioned by fiscal measures in some countries and to fade over time. Consumer confidence has also improved in recent months, but it remains below the levels prevailing before the start of the conflict, still pointing to cautious consumption behaviour. Looking ahead, household consumption growth is expected to strengthen, supported by a recovery in real wage growth, resilient employment and, to a lesser extent, favourable wealth effects. The household saving rate is expected to gradually decline over the horizon as uncertainty recedes and precautionary motives wane amid persistently high interest rates.
- Government consumption is expected to continue supporting medium-term growth. Following a robust contribution to growth in 2026, the temporary slowdown foreseen in 2027 is mainly on account of the expiration of Next Generation EU (NGEU) funding in Italy and further assumed budgetary savings in France (see also Box 3).
- Investment growth is expected to be supported by spending on AI, defence and infrastructure and by a gradual recovery in housing investment. After a weak performance in the second quarter of 2026, business investment (excluding volatile Irish intellectual property product investment) is expected to pick up, despite some lingering uncertainty surrounding the Middle East conflict, related to energy prices and supply bottlenecks, and gradually tightening financing conditions. The recovery should be supported by improving demand and by digitalisation efforts reflecting rapid global advances in AI. Spillovers to the private sector from increased defence and infrastructure spending and gradually strengthening profits are also anticipated to underpin business investment. This would offset a drag from public investment growth, which is seen to slow in 2027-28 following the expiry of the NGEU programme. Housing investment grew notably less than previously projected in the first half of 2026, reflecting in part the impact of adverse weather conditions and tighter financing conditions. Nevertheless, housing investment is still expected to recover gradually, supported by persistent housing demand in the context of rising real wages. It is also seen to benefit from the continuing strength of finishing and installation works that are largely driven by renovation activities such as energy-efficiency improvements.[6]
- Exports are projected to remain subdued, reflecting persistent euro area competitiveness challenges exacerbated by factors such as US tariffs and the overall appreciation of the euro since the end of 2024. In the short term, the Middle East conflict, though still a factor dampening export growth, has proven to be less damaging than anticipated, implying upward revisions compared with the June projections. However, export competitiveness is projected to remain weak. The past appreciation of the euro and higher US tariffs continue to constrain exports. The pick-up in global demand is providing some support to exports. However, much of this strength is driven by the AI boom and, reflecting the smaller size of its AI goods sector, the euro area is expected to benefit less than some other economies.[7] As a result, the euro area’s share in global export markets is expected to decline slightly further over the medium term. Import growth is seen to outpace export growth in 2026, driven by import demand, before being broadly in line with exports over the medium term. AI and defence-related investment is expected to generate import demand in the medium run. Overall, net exports are projected to have a slightly negative impact on real GDP growth in 2026 and to provide a small positive contribution in 2027 and in 2028.
Domestic demand is expected to be supported by defence and infrastructure spending. The impact on growth from fiscal spending on defence and infrastructure, mostly accounted for by Germany and with the highest impulse in 2026, is estimated to be 0.5 percentage points cumulatively over 2025-28.[8] The energy support measures adopted by governments since the start of the war in the Middle East are predominantly temporary and have only a marginal impact on growth.
Chart 2
Euro area real GDP growth – decomposition into the main expenditure components
(annual percentage changes and percentage point contributions)
Notes: Data are seasonally and working day-adjusted. Historical data may differ from the latest Eurostat publications owing to data releases after the cut-off date for the projections. The vertical line indicates the start of the projection horizon. 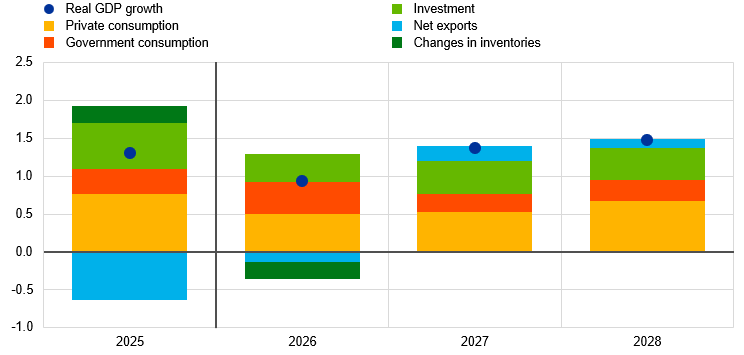
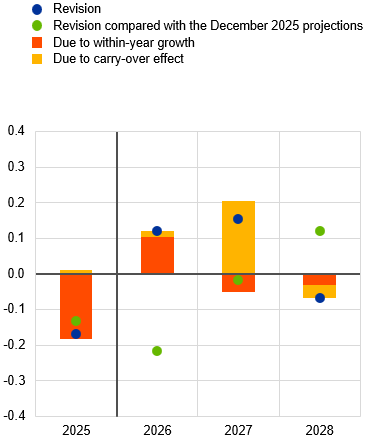
Compared with the June 2026 projections, real GDP growth has been revised up by 0.1 percentage points for 2026 and by 0.2 percentage points for 2027, while remaining unrevised for 2028 (Chart 3 and Table 2). A significant downward revision to GDP growth in the first quarter of 2026 related to revisions to Irish data was more than offset by the upward surprise to GDP growth in the second quarter and a stronger outlook for the second half of the year, resulting in a small upward revision to the growth projection for 2026. The stronger short-term outlook mainly relates to an improvement in the short-term investment outlook in line with recent indicators, a stronger private consumption profile given some reduction in uncertainty, and the more positive international environment. The upward revisions for the second half of 2026 imply significant carry-over effects in 2027, while revisions owing to within-year growth are close to zero in both 2027 and 2028. Real GDP, using modified domestic demand for Ireland, has been revised up by 0.3 percentage points for 2026 and 0.1 percentage points for 2027, and has been revised down by 0.1 percentage points for 2028. Compared with the December 2025 projections (the baseline before the outbreak of the war in the Middle East), growth has been revised down by 0.3 percentage points for 2026, remains unrevised for 2027 and has been revised up by 0.1 percentage points for 2028, leaving the level of GDP at the end of the horizon slightly lower (Chart 1, panel b, and Chart 3, panel a).
Chart 3
Revisions to the real GDP growth projections compared with the June 2026 projections
|
a) Decomposition into within-year and carry-over effects |
b) Decomposition into the main expenditure components |
|---|---|
|
(percentage points) |
(percentage points) |
 |
 |
Notes: The vertical line indicates the start of the projection horizon. Revisions are based on unrounded figures. In panel b), “MDD” refers to the modified domestic demand measure.
Table 2
Real GDP, trade and labour market projections
(annual percentage changes, unless otherwise indicated, revisions in percentage points)
|
September 2026 |
Revisions vs June 2026 |
||||||
|---|---|---|---|---|---|---|---|
|
2025 |
2026 |
2027 |
2028 |
2026 |
2027 |
2028 |
|
|
Real GDP |
1.3 |
0.9 |
1.4 |
1.5 |
0.1 |
0.2 |
0.0 |
|
Real GDP with modified domestic demand for Ireland1) |
1.1 |
1.2 |
1.2 |
1.4 |
0.3 |
0.1 |
-0.1 |
|
Private consumption |
1.5 |
1.0 |
1.0 |
1.3 |
0.2 |
0.0 |
-0.1 |
|
Government consumption |
1.5 |
1.9 |
1.1 |
1.3 |
0.3 |
0.1 |
0.0 |
|
Investment |
2.9 |
1.8 |
2.0 |
2.0 |
0.0 |
0.3 |
-0.1 |
|
Exports2) |
2.0 |
2.1 |
3.2 |
2.9 |
1.0 |
0.6 |
0.0 |
|
Imports2) |
3.6 |
2.6 |
3.0 |
2.9 |
1.0 |
0.6 |
-0.1 |
|
Contribution to GDP from: |
|
|
|
|
|
|
|
|
Domestic demand |
1.7 |
1.3 |
1.2 |
1.4 |
0.2 |
0.1 |
-0.1 |
|
Net exports |
-0.6 |
-0.1 |
0.2 |
0.1 |
0.1 |
0.0 |
0.0 |
|
Inventory changes |
0.2 |
-0.2 |
0.0 |
0.0 |
-0.1 |
0.0 |
0.0 |
|
Real disposable income |
0.9 |
0.6 |
1.1 |
1.0 |
0.3 |
0.1 |
-0.1 |
|
Household saving rate (% of disposable income) |
14.6 |
14.1 |
14.1 |
13.9 |
0.0 |
0.0 |
0.0 |
|
Employment3) |
0.7 |
0.5 |
0.5 |
0.5 |
0.1 |
0.0 |
-0.1 |
|
Unemployment rate |
6.3 |
6.2 |
6.1 |
5.9 |
-0.1 |
-0.1 |
-0.1 |
|
Current account (% of GDP) |
1.6 |
1.5 |
1.5 |
1.7 |
0.2 |
0.0 |
0.2 |
Notes: Real GDP and components refer to seasonally and working day-adjusted data. Historical data may differ from the latest Eurostat publications owing to data releases after the cut-off date for the projections. Revisions are calculated from rounded data.
1) Modified domestic demand is described in footnote 4.
2) This includes intra-euro area trade.
3) Persons employed.
The labour market is projected to remain broadly resilient, in line with the improved outlook for economic activity. The current projections reflect a stronger starting point of the labour market, linked to higher economic activity than previously expected (when adjusting for volatility in Irish data) since the beginning of the year, highlighting the resilience of the euro area economy in the face of the Middle East conflict. As a consequence, compared with the June projections, employment growth is projected to be higher in 2026, is unrevised for 2027 and has been revised down slightly for 2028, increasing at a stable annual growth rate of around 0.5% (Chart 4, panel a). Labour productivity is seen to continue to recover, increasing steadily throughout the projection horizon. As employment usually reacts less than economic activity to business cycles, labour productivity growth has been revised up for the second half of 2026 (as economic growth turned out stronger than employment in the first half of the year), and in 2027, and marginally down for 2028. The unemployment rate is expected to decline over the projection horizon, reaching a level of 5.9% in 2028, which is a slight downward revision compared with the June projections (Chart 4, panel b). This revision is driven by the more positive output and employment growth in 2026. Furthermore, structural forces, such as demographics, continue to contribute to a lower unemployment rate (but in line with the assumptions already embedded in the June projections).
Chart 4
Labour markets
|
a) Employment |
b) Unemployment rate |
|---|---|
|
(annual percentage changes) |
(percentage of labour force) |
 |
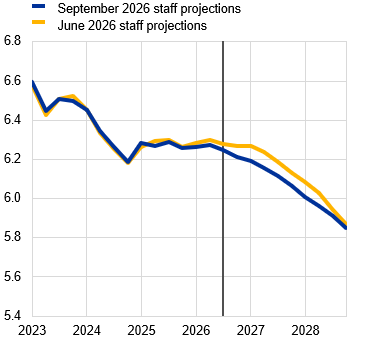 |
Note: The vertical line indicates the start of the current projection horizon.
Box 1
International environment
The global economy remains broadly resilient, supported by sustained AI-related investment and easing supply shortages relative to the June 2026 projections – although the Middle East conflict remains unresolved.[9] Global growth remained resilient in the second quarter of 2026, as weakness in the United States and China was offset by strength in economies exporting AI hardware (e.g. Taiwan and South Korea). Global imports surprised markedly on the upside, with import growth in the second quarter standing significantly above the June projection. This reflected strong AI-related trade and a temporary frontloading of tariff-sensitive and energy-intensive goods imports. Incoming indicators point to continued resilience of GDP growth and strength of global trade in the third quarter, supported by sustained AI infrastructure investment and easing supply shortages. Annual global inflation rose to 3.4% in the second quarter, in line with the June projection, as higher energy costs raised consumer prices across the global economy.
Global growth is expected to recover gradually, remaining below its average for the period before the COVID-19 pandemic, despite modest upward revisions (Table A). Global real GDP growth is projected to be 3.1% in 2026, 3.3% in 2027 and 3.4% in 2028. It has been revised up by 0.1 percentage points for each year of the projection horizon, with easing supply shortages expected to improve prospects broadly and stronger AI-related infrastructure investment expected to support economies integrated in the technology supply chain. Unexpectedly resilient private consumption in the United States in recent quarters has also driven upward revisions for US economic activity over the projection horizon. In China, the weak outturn for growth in the second quarter has led to a downward revision for 2026, while stronger expected AI infrastructure investment has driven an upward revision for 2027.
Global disinflation is expected to resume after a temporary rise in inflation in 2026, with offsetting price pressures leaving the outlook unchanged from the June 2026 projections.[10] Global inflation is projected to be 3.5% in 2026, 3.0% in 2027 and 2.5% in 2028. Lower oil prices over the projection horizon are offset by higher gas prices, elevated refining margins – which limit the pass-through from lower crude oil prices to refined petroleum products – and stronger price pressures in AI-related goods, for which import prices rose markedly. The unchanged global inflation projection masks upward revisions for the United States and some technology-producing economies, and downward revisions for China and central and eastern European countries.
The projections for euro area foreign demand and export prices of euro area competitors are stronger than in June, but the increases are concentrated in AI-related trade flows to which euro area exporters have relatively limited exposure. Euro area foreign demand is projected to grow by 3.6% in 2026, 4.0% in 2027 and 3.4% in 2028, revised up by 0.4 percentage points for 2026 and 0.6 percentage points for 2027, with 2028 unchanged versus the June 2026 projections. The revisions reflect positive surprises in the second quarter of 2026 and the associated carry-over effect, as well as stronger AI infrastructure investment with high trade-intensity. These factors more than offset the unwinding of the temporary frontloading observed in the second quarter of 2026. Inflation in the export prices of euro area competitors in national currency is projected to jump to 7.0% in 2026, before slowing to 3.0% in 2027 and 1.7% in 2028. The upward revisions compared with the June 2026 projections – by 2.8 percentage points in 2026 and 0.5 percentage points in 2027 – reflect large upside surprises in the export prices of South Korea, Japan, the United States and China as memory-chip and related technology prices have surged. The steep slowdown after 2026 reflects a projected moderation in AI-related goods price increases, together with the disinflationary impact of lower oil prices. Given that upward revisions to euro area foreign demand and competitors’ export prices are concentrated in AI goods – where the euro area has a small market share – they do not translate fully into stronger euro area exports (see Section 2.1 for more details).
Table A
The international environment
(annual percentage changes, revisions in percentage points)
|
|
September 2026 |
Revisions vs June 2026 |
||||||
|---|---|---|---|---|---|---|---|---|
|
2025 |
2026 |
2027 |
2028 |
2025 |
2026 |
2027 |
2028 |
|
|
World real GDP (excluding the euro area) |
3.7 |
3.1 |
3.3 |
3.4 |
0.1 |
0.1 |
0.1 |
0.1 |
|
Global trade (excluding the euro area)1) |
5.4 |
4.7 |
4.5 |
3.5 |
-0.1 |
0.5 |
0.9 |
0.0 |
|
Euro area foreign demand2) |
4.6 |
3.6 |
4.0 |
3.4 |
0.0 |
0.4 |
0.6 |
0.0 |
|
World CPI (excluding the euro area) |
3.1 |
3.5 |
3.0 |
2.5 |
0.0 |
0.0 |
0.0 |
0.0 |
|
Export prices of competitors in national currency3) |
1.3 |
7.0 |
3.0 |
1.7 |
0.1 |
2.8 |
0.5 |
0.0 |
Note: Revisions are calculated from rounded figures.
1) Calculated as a weighted average of imports.
2) Calculated as a weighted average of imports of euro area trading partners.
3) Calculated as a weighted average of the export deflators of euro area trading partners.
Box 2
Technical assumptions
Compared with the June 2026 projections, the technical assumptions entail lower oil and farm gate prices, higher gas and electricity prices, a weaker euro, broadly unchanged interest rates and higher equity prices. Oil prices have declined and are assumed to average USD 88 per barrel in the third quarter of 2026, nearly 15% lower than assumed for that quarter in the June projections, but over 40% higher than in the December 2025 projections, reflecting the ongoing Middle East conflict. Gas prices, in contrast, have been revised up by 20% compared with the June projections and are at double the level assumed for the third quarter of 2026 in the December 2025 projections. This is related to a significant extent to the low gas storage levels in Europe. Electricity prices have been revised up by 50% for the third quarter of 2026 compared with the June projections, which could in part have been triggered by weather-related higher demand and lower supply. However, the revisions for the rest of the projection horizon are broadly in line with the gas price revisions. Euro area farm gate prices in July 2026 were around 9% lower than expected, despite recent extreme weather events, leading to downward revisions to the assumed path in 2026 and 2027. However, assumptions for international food prices have been revised up moderately, partly reflecting concerns regarding the intensity of this year’s El Niño effect and driven almost fully by large price increases for coffee and cocoa. The euro has depreciated by 1.0% vis-à-vis the US dollar and by 0.3% in nominal effective terms since the June projections. Market expectations for short-term interest rates have been revised up by 0.2 percentage points for 2027 compared with the June projections and by 0.3 percentage points for 2028, while long-term rates have been revised up by around 0.1-0.2 percentage points for the period 2027-28.
Table A
Technical assumptions
|
September 2026 |
Revisions vs June 2026 |
||||||
|---|---|---|---|---|---|---|---|
|
2025 |
2026 |
2027 |
2028 |
2026 |
2027 |
2028 |
|
|
Commodities: |
|
|
|
|
|
|
|
|
Oil price (USD/barrel) |
69.1 |
89.5 |
78.0 |
73.6 |
-7.6 |
-5.1 |
-4.6 |
|
Natural gas prices (EUR/MWh) |
36.2 |
51.0 |
43.3 |
30.3 |
11.7 |
15.5 |
8.8 |
|
Wholesale electricity prices (EUR/MWh) |
83.6 |
108.7 |
90.2 |
73.1 |
21.7 |
15.3 |
7.4 |
|
EU Emissions Trading System 1 (ETS1) allowances (EUR/tonne of CO2) |
73.9 |
78.4 |
83.3 |
86.4 |
5.0 |
9.1 |
9.1 |
|
EU Emissions Trading System 2 (ETS2) allowances (EUR/tonne of CO2) |
– |
– |
– |
46.0 |
– |
– |
0.0 |
|
Non-energy commodity prices, in USD (annual percentage change) |
5.8 |
3.5 |
3.0 |
-0.1 |
0.5 |
2.2 |
1.8 |
|
Euro area farm gate prices (annual percentage change) |
4.1 |
-6.6 |
-1.3 |
-0.1 |
-6.2 |
-4.2 |
0.1 |
|
Exchange rates: |
|
|
|
|
|
|
|
|
USD/EUR exchange rate |
1.13 |
1.16 |
1.16 |
1.16 |
-0.8 |
-1.0 |
-1.0 |
|
Euro nominal effective exchange rate (EER40) (Q1 1999 = 100) |
128.3 |
129.6 |
129.4 |
129.4 |
-0.3 |
-0.3 |
-0.3 |
|
Financial assumptions: |
|
|
|
|
|
|
|
|
Three-month EURIBOR (percentage per annum) |
2.2 |
2.4 |
3.0 |
3.0 |
0.0 |
0.2 |
0.3 |
|
Ten-year government bond yields (percentage per annum) |
3.1 |
3.5 |
3.8 |
4.0 |
0.0 |
0.2 |
0.1 |
Notes: Revisions are expressed as percentages for levels and as percentage points for growth rates and percentages per annum. Revisions for growth rates and interest rates are calculated on figures rounded to one decimal place, while revisions reported as percentage changes are calculated on unrounded figures. The technical assumptions about euro area interest rates and commodity prices are based on market expectations, with a cut-off date of 19 August 2026. Oil prices refer to Brent crude oil spot and futures prices. Gas prices refer to the Dutch TTF gas spot and futures prices. Electricity prices refer to the average wholesale spot and futures price for the five largest euro area countries. The use of electricity price assumptions in the staff projections differs across euro area countries according to differences in price-setting practices for consumer electricity prices. The “synthetic” futures price for ETS1 allowances (EUA) is derived as the end-of-month linearly interpolated value of the two nearest European Energy Exchange EUA futures. Monthly EUA futures prices are then averaged to produce an equivalent to annual frequency. In the absence of meaningful trading of ETS2 allowances, the price assumptions were set by staff in line with the assumption of the European Commission in its Autumn 2025 Economic Forecast (see the box entitled “The macroeconomic impact of climate change policies in the euro area” in the December 2025 Eurosystem projections). The paths of commodity prices are implied by futures markets in the ten working days ending on the cut-off date, except for that of euro area farm gate prices, which is forecasted using an econometric model that takes into account developments in international food commodity prices. Bilateral exchange rates are assumed to remain unchanged over the projection horizon at the average levels prevailing in the ten working days ending on the cut-off date. The assumptions for euro area ten-year nominal government bond yields are based on the average of countries’ ten-year bond yields, weighted by annual GDP figures. Where the necessary data exist, the country-specific ten-year nominal government bond yields are calculated as the ten-year benchmark bond yields prolonged using the forward par yields derived, on the cut-off date, from the corresponding country-specific yield curves. For the other countries, the country-specific ten-year government bond yields are calculated as the ten-year benchmark bond yields prolonged using a constant spread (observed on the cut-off date) over the technical euro area risk-free long-term interest rate assumption.
Box 3
Fiscal outlook
After turning neutral in 2025, the euro area fiscal stance is projected to loosen by 0.5 percentage points of GDP in 2026 and to tighten cumulatively by a similar amount over 2027-28 (Table A).[11] The loosening in 2026 is broad-based on the spending side (government investment, consumption and fiscal transfers, continuing trends from 2025). The increase in investment reflects primarily high defence and infrastructure spending in Germany, alongside some smaller countries, as well as projects under the Next Generation EU (NGEU) programme. The increase in fiscal transfers reflects high growth rates of pension expenditure and other social payments, as well as NGEU-funded capital transfers to firms. Additionally, the baseline includes 0.1% of GDP in temporary energy support measures (mostly lower indirect taxes and higher subsidies) granted by governments since the start of the Middle East conflict. In 2027, beyond the projected reversal of the energy support, the tightening in the fiscal stance is broad-based across countries, including Spain, France and Italy (following the expiry of most NGEU financing, among other factors). This is only partly offset by continuing stimulus in Germany. The remaining tightening for 2027 and in 2028 is explained by non-discretionary factors.[12]
Compared with the June projections, the fiscal stance is expected to be broadly unchanged over the projection horizon, after having been looser in 2025. Revised historical data for Germany and France point to a somewhat looser fiscal stance in 2025. In 2026, a slight loosening resulting from an extension of energy support measures and other spending is only partly offset by increases in social security contributions and direct taxes. Some of these loosening effects (below 0.1 percentage points of GDP) reverse afterwards, particularly in 2027.
The euro area budget deficit is projected to peak at 3.7% of GDP in 2027 and to decline only slightly afterwards, while the debt ratio is seen to continue increasing over the horizon, reaching just below 90% in 2028. Most of the marked increase in the deficit from its 2025 level (revised up to 3.0% of GDP) takes place in 2026, reflecting the loosening fiscal stance. Interest payments are projected to increase by 0.2 percentage points of GDP in 2026 and by another 0.3 percentage points over the next two years. These developments are broadly offset by the positive cyclical component and the tightening fiscal stance in 2027 and 2028, leading to a slight decline in the deficit in 2028. The euro area debt ratio remains on an increasing path as the continuous primary deficits and positive deficit-debt adjustments outweigh the favourable effects of interest rate-growth differentials. Compared with the June projections, the euro area deficit outlook is broadly unchanged. The base effect from a higher deficit in 2025 (stemming from Germany) and the slight loosening in 2026 is offset by more favourable cyclical developments. The downward revision in the debt ratio path reflects a revision for 2025 and more favourable interest rate-growth differentials on account of higher nominal GDP growth.
Table A
Fiscal outlook for the euro area
(percentages of GDP; revisions in percentage points)
|
|
September 2026 |
Revisions vs June 2026 |
|||||||
|---|---|---|---|---|---|---|---|---|---|
|
2024 |
2025 |
2026 |
2027 |
2028 |
2025 |
2026 |
2027 |
2028 |
|
|
Fiscal stance1) |
0.8 |
0.0 |
-0.5 |
0.4 |
0.2 |
-0.1 |
0.0 |
0.0 |
0.0 |
|
General government budget balance |
-3.1 |
-3.0 |
-3.6 |
-3.7 |
-3.6 |
-0.1 |
0.0 |
0.0 |
0.0 |
|
Structural budget balance2) |
-3.1 |
-3.2 |
-3.7 |
-3.9 |
-3.9 |
-0.1 |
-0.2 |
-0.2 |
-0.2 |
|
General government gross debt |
86.2 |
87.1 |
88.2 |
88.8 |
89.4 |
-0.3 |
-0.4 |
-0.5 |
-0.6 |
Notes: Revisions are based on unrounded figures.
1) The fiscal stance is measured as the change in the cyclically adjusted primary balance. The figures shown are also adjusted for paid and expected grants under the NGEU programme, which do not have an impact on the economy on the revenue side. A negative (positive) figure implies a loosening (tightening) of the fiscal stance.
2) The structural budget balance is calculated as the government balance net of transitory effects of the economic cycle (or the cyclically adjusted primary balance, referenced above, plus interest payments) and net of measures classified under the European System of Central Banks definition as temporary.
2.2 Prices and costs
After recent volatility linked to the evolving Middle East conflict, headline HICP inflation stood at 2.9% in July.[13] The slight increase in the headline rate from 2.8% in June (after 3.2% in May) reflected higher rates for the energy component, mostly for transport fuels in line with more expensive refined oil products, and the end of some government support measures, as well as higher rates for the services component and for the non-energy industrial goods (NEIG) component.[14] HICPX inflation increased slightly, to 2.5% in July. Meanwhile, food inflation declined further amid subdued pipeline pressures, including past declines in food commodity and producer prices. Overall, the effects of the war in the Middle East on non-energy consumer prices have thus far been limited, as is also evident in contained dynamics in measures of underlying inflation and pipeline price pressures at the later stages of the pricing chain, with recent data indicating smaller than expected indirect effects on food prices.
Headline inflation is projected to increase to 3.0% in 2026, from 2.1% in 2025, mainly driven by higher energy prices, and then to decline to 2.1% in 2028 as the energy shock fades (Chart 5 and Table 3). Conditional on the market-based assumptions for energy commodity prices, headline inflation is expected to increase to 3.6% in the fourth quarter of 2026, driven by higher energy inflation but also reflecting higher rates for the NEIG and food components. It is then expected to decline in early 2027, owing mostly to large downward energy base effects. While headline inflation is projected to fall sharply in the second quarter of 2027 to stand at 2.5%, indirect effects from higher energy prices are expected to materialise gradually in non-energy inflation, albeit to a lesser extent than during the inflationary episode in 2021-24. HICP inflation excluding energy is expected to be 2.6% on average in 2027, up from 2.3% in 2026. Headline inflation is expected to stabilise close to 2.0% over the medium term, as the contribution from energy inflation is seen to be close to zero and the indirect and second-round effects of the energy shock are also expected to be contained. Scenarios with alternative paths for energy prices and with stronger indirect and second-round effects than assumed in the baseline are outlined in Box 4.
Chart 5
Euro area HICP inflation and components
(annual percentage changes, percentage points)
Notes: The horizontal line denotes the inflation target of 2% over the medium term. The vertical line indicates the start of the current projection horizon. 
Energy inflation is projected to peak at the end of 2026 at almost 15%, then to fall sharply in 2027 owing to negative base effects and lower energy commodity prices, and to rise again in 2028 with the introduction of ETS2 (Chart 6). The war in the Middle East has led to large increases in energy commodity prices (see Box 2), and uncertainty about its evolution remains sizeable. In addition, prices for refined transport fuels have increased by significantly more than crude oil prices as the global supply of refined fuels has declined owing to the closure of the Strait of Hormuz amid higher seasonal demand and further supply restrictions stemming from Ukrainian attacks on Russian refining capacity. The resultant elevated EU-specific refining margins for diesel and, to a lesser extent, for petrol, will put further upward pressure on energy inflation, mainly in the short term.[15] While elevated margins tended not to persist for long in the past as the balance of supply and demand adjusted and the refineries modified their product mix, the scale of the current dislocation may make such adjustments more difficult and slower than in the past. For wholesale electricity prices, part of the recent increase may be linked to the summer heatwaves increasing reliance on more expensive gas-fired electricity generation. In 2026 the impact of the government measures to compensate for the effects of the inflationary shock is expected to be only -1.0 percentage point for energy inflation and slightly less than -0.1 percentage points for headline inflation.[16] Following large downward base effects early in 2027 and market expectations of declining oil, gas and electricity prices (as well as refined fuel prices), energy inflation is seen to drop into negative territory in the second half of 2027 and the first half of 2028. In 2028 the introduction of ETS2 is expected to push energy inflation up, but it is projected to average less than zero.[17] Excluding the impact of ETS2, headline inflation would stand at 1.9% in 2028.
Chart 6
Euro area HICP energy inflation
(annual percentage changes)
Note: The vertical line indicates the start of the current projection horizon.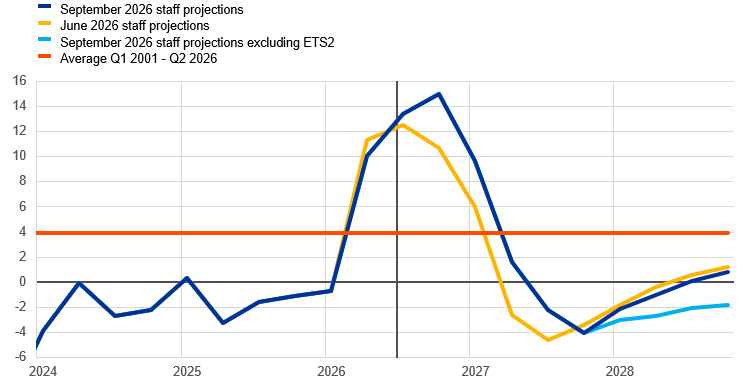
Food inflation is projected to recover from the recent low levels and increase in the short term, amid gradually unfolding indirect effects from past increases in energy prices and the impact of adverse weather, before falling back towards 2% later in the projection horizon (Chart 7). Food inflation is expected to increase over the next four quarters, peaking at 3.4% in the third quarter of 2027. This reflects the unfolding energy shock, which is also evident in food commodity prices. However, the impact has so far been more moderate than previously expected, as indicated by recent negative projection errors and the ongoing decline in pressures from imported food prices, domestic farm gate prices and producer prices for food. Furthermore, global fertiliser prices have retreated from the sharp increase recorded in the spring, and EU support measures have been adopted to mitigate the energy and fertiliser cost shock.[18] At the same time, the summer heatwaves and the ongoing El Niño also point to an upward sloping path of food inflation. Nevertheless, the outlook for food inflation is surrounded by high uncertainty and remains contingent on energy and weather developments, with the latter likely to have diverse effects on food prices across countries and over time. While some food commodity and wholesale electricity price assumptions partly capture recent extreme weather events, there is sizeable uncertainty surrounding the weather effects on food inflation over the projection horizon. A confluence of past and potential future weather events – mild weather in the spring of 2026, the hot and dry summer and uncertain implications for weather in Europe owing to the El Niño episode – may have offsetting effects. As commodity prices stabilise and the indirect effects from higher energy prices fade, food inflation is projected to decline towards the end of the projection horizon.
Chart 7
Euro area HICP food inflation
(annual percentage changes)
Notes: The vertical line indicates the start of the current projection horizon.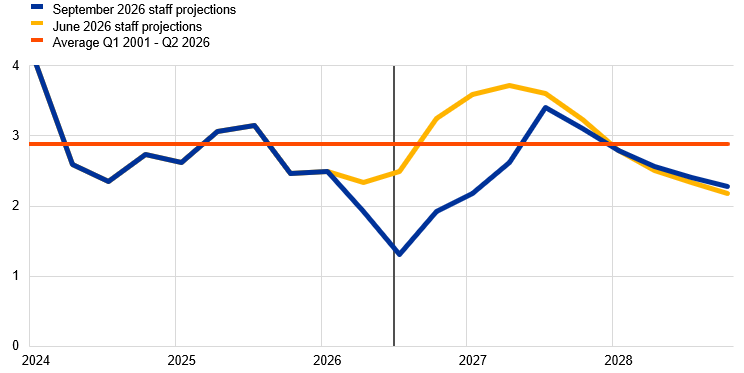
HICPX inflation is expected to rise gradually over the short term and to average 2.5% in 2026 and 2.6% in 2027, before declining to 2.3% in 2028 (Chart 8). In the short term, HICPX inflation is projected to rise gradually and peak in the first quarter of 2027 at 2.8%, driven by a strong increase in NEIG inflation to 1.9%, while services inflation is expected to be broadly stable around 3.3%. This HICPX profile reflects the gradual build-up of the indirect effects from higher energy prices both domestically and globally as import prices and manufacturing input costs increase. The health sector-related reform in Germany is also expected to push up euro area HICPX inflation slightly in 2027.[19] These factors are seen to be partly tempered by easing labour cost pressures in the near term, the past appreciation of the euro (which dominates the more recent depreciation) and downward pressure from prices of imports from China, although continued reflation in China should unwind some of this pressure. HICPX inflation is then projected to decline over the course of 2027, reflecting easing price pressures in both the NEIG and services components. In 2028 both NEIG and services inflation rates are expected to stabilise as indirect effects fade and second-round effects via wages are expected to be limited.[20] An assessment of the second-round effects on HICPX inflation in response to the energy price shock, based on the ECB-BASE model and the Bernanke-Blanchard model for the euro area, suggests a small upward impact on average (of around 0.1-0.2 percentage points) in 2027-28, which is broadly unchanged relative to the June 2026 projections.[21] HICPX inflation is seen to decline to 2.3% at the end of the horizon, with services inflation standing at 2.9% and NEIG inflation at 1.1%.
Chart 8
Euro area HICPX inflation
(annual percentage changes)
Notes: The vertical line indicates the start of the current projection horizon. The solid lines refer to the September 2026 staff projections and the dashed lines refer to the June 2026 staff projections. The horizontal dotted lines refer to the average rates from the first quarter of 2001 to the second quarter of 2026. 
Compared with the June 2026 projections, the outlook for headline HICP inflation has been revised up by 0.2 percentage points for 2027, and by 0.1 percentage points for 2028 (Chart 9, panel a). Downward revisions to food inflation are broadly offset by upward revisions to energy inflation in 2026, while over the course of 2027 higher energy inflation and, to a lesser extent, NEIG inflation, more than offset downward revisions to food inflation.[22] The lower food inflation profile in the near term is driven by recent negative projection errors, owing to weaker than expected recent outturns for prices of domestic food commodities and some international food commodities, smaller than expected indirect effects of the energy price shock, and more favourable weather conditions in early 2026. In addition, to a lesser extent, downward revisions to the food component incorporate lower domestic food commodity price assumptions and somewhat smaller (and more delayed) indirect effects than previously expected. Upward revisions to energy inflation, partly dampened by recent negative surprises owing to lower oil prices and lower oil price assumptions, are consistent with higher gas and electricity price assumptions, as well as higher refining margins. For 2028, a small upward revision to HICP inflation is driven by the services component and is consistent with a small upward revision to compensation per employee growth over the projection horizon (Table 3).
The revisions since the December 2025 projections provide a more complete picture of the impact of the war in the Middle East, showing the expected unfolding of the energy shock (Chart 9, panel b). Since then headline inflation has been revised up substantially for 2026 and 2027 (by 1.1 percentage points and 0.7 percentage points respectively), reflecting the immediate effect on energy inflation and its delayed pass-through to non-energy components. Headline inflation has been revised up only slightly for 2028 (by 0.1 percentage points) as lower energy inflation is seen to broadly offset the upward indirect effects and limited second-round effects on the non-energy component (Chart 9, panel b). HICP inflation excluding energy has been revised up by a cumulative 1.0 percentage point mainly owing to indirect effects and, to a lesser extent, second-round effects from the energy shock.
Chart 9
Revisions to the inflation projection
a) Comparison with the June 2026 projections
(percentage points and percentage point contributions)

b) Comparison with the December 2025 projections
(percentage points and percentage point contributions)
Notes: The revisions are calculated based on unrounded figures. The vertical lines indicate the start of the current projection horizon.
Table 3
Price and cost developments for the euro area
(annual percentage changes, revisions in percentage points)
|
|
September 2026 |
Revisions vs June 2026 |
|||||
|---|---|---|---|---|---|---|---|
|
2025 |
2026 |
2027 |
2028 |
2026 |
2027 |
2028 |
|
|
HICP |
2.1 |
3.0 |
2.5 |
2.1 |
0.0 |
0.2 |
0.1 |
|
HICP excluding ETS21) |
2.1 |
3.0 |
2.5 |
1.9 |
0.0 |
0.2 |
0.0 |
|
HICP excluding energy |
2.5 |
2.3 |
2.6 |
2.3 |
-0.2 |
-0.1 |
0.1 |
|
HICP excluding energy and food |
2.4 |
2.5 |
2.6 |
2.3 |
0.0 |
0.1 |
0.1 |
|
HICP excluding energy, food and changes in indirect taxes |
2.4 |
2.4 |
2.6 |
2.3 |
0.0 |
0.1 |
0.1 |
|
HICP non-energy industrial goods |
0.6 |
1.0 |
1.7 |
1.1 |
0.1 |
0.2 |
0.0 |
|
HICP services |
3.4 |
3.3 |
3.0 |
2.9 |
0.0 |
0.0 |
0.1 |
|
HICP energy |
-1.4 |
9.3 |
1.0 |
-0.6 |
0.9 |
2.3 |
-0.5 |
|
HICP food |
2.8 |
1.9 |
2.8 |
2.5 |
-0.7 |
-0.7 |
0.1 |
|
GDP deflator |
2.4 |
2.5 |
2.5 |
2.2 |
0.1 |
0.0 |
0.1 |
|
Private consumption deflator |
2.1 |
2.9 |
2.4 |
2.2 |
-0.1 |
0.0 |
0.1 |
|
Import deflator |
0.1 |
4.0 |
2.6 |
1.3 |
0.3 |
0.5 |
0.0 |
|
Compensation per employee |
3.8 |
3.3 |
3.3 |
3.3 |
0.1 |
0.1 |
0.1 |
|
Real compensation per employee |
1.7 |
0.4 |
0.8 |
1.1 |
0.3 |
0.0 |
0.1 |
|
Productivity per employee |
0.6 |
0.4 |
0.9 |
0.9 |
0.0 |
0.1 |
-0.1 |
|
Unit labour costs |
3.2 |
2.8 |
2.4 |
2.3 |
0.0 |
0.0 |
0.1 |
|
Unit profits2) |
0.6 |
1.9 |
2.3 |
2.2 |
0.3 |
0.0 |
-0.1 |
Notes: Revisions are calculated from rounded data. The figures for the GDP and import deflators, unit labour costs, compensation per employee and productivity per employee refer to seasonally and working day-adjusted data. Historical data may differ from the latest Eurostat publications owing to data releases after the cut-off date for the projections.
1) Regarding the impact of ETS2 on the HICP rate in 2028, see footnote 17.
2) Unit profits are defined as gross operating surplus and mixed income (adjusted for the income of the self-employed) per unit of real GDP.
Nominal wage growth is expected to ease further throughout 2026, averaging 3.3% for the whole year, and to stabilise at this level in the medium term. Growth in compensation per employee (CPE) eased further to 3.5% in the first quarter of 2026 – 0.2 percentage points above the June 2026 projections but 0.2 percentage points below the December 2025 projections. It is expected to continue declining over the next few quarters in line with the fading of the large energy shock of 2021-24, before picking up in early 2027.[23] CPE growth is expected to slow from 3.8% in 2025 to 3.3% in 2026 and then to stay at this level, which is above its long-term average, in 2027 and 2028 supported by the improving economic outlook and the resilient labour market, while the expected decline in inflation is seen to limit wage demands (Chart 10, panel a). Real wage growth is projected to decline towards the end of 2026 and then to gradually recover over the course of 2027 and converge towards productivity growth in 2028 (Chart 10, panel b).
Compared with the June 2026 projections, CPE growth has been revised up slightly over the whole projection horizon in the context of a slight improvement in the labour market. The revisions compared with the June projections (a 0.1 percentage point increase in each year of the horizon) are in line with the upward data surprise in the first quarter of 2026, a stronger economic outlook and a slight downward revision to the unemployment rate, while the assessment of the strength of second-round effects remains broadly unchanged. Relative to the December 2025 projections, CPE growth has been revised up more notably, rising by 0.1, 0.4 and 0.3 percentage points for 2026, 2027 and 2028 respectively (Chart 10, panel a). Nevertheless, the current energy shock is expected to have a more limited upward effect on the outlook for wages compared with the 2021-24 episode, owing to less buoyant demand conditions and the more benign inflation environment at the time of the shock, though uncertainty related to the Middle East conflict remains high.
Growth in unit labour costs is projected to decline over the near term and to remain broadly stable, averaging 2.4% over 2027-28 (Chart 10, panel b). The slowdown over the course of 2026 is explained by both declining wage growth and increasing productivity growth. Over the medium term, unit labour cost growth is seen to be broadly stable, in line with the path of productivity and wage growth. It has been revised up for 2028, reflecting somewhat higher wage growth and slightly lower productivity growth in the context of a robust labour market. GDP deflator growth is expected to increase moderately in the near term owing to higher growth in unit profits, in line with the economic recovery and relatively limited adverse effects of the energy shock, which are seen to be partly compensated by a lower contribution from unit labour costs. It is then expected to decline to 2.2% on average in 2028.
Chart 10
Euro area wage developments
a) Compensation per employee
(annual percentage changes)

b) Real compensation per employee, productivity and unit labour costs
(annual percentage changes)
Notes: The vertical lines indicate the start of the current projection horizon. In panel b), the figures are deflated by the private consumption deflator. The dotted lines refer to the June 2026 staff projections.
Import price growth is projected to increase in the second half of 2026, peaking in the fourth quarter at 6.7%, year on year, driven by higher energy prices and AI-related goods prices, before stabilising at 1.3% in 2028. In annual terms, the growth rate of the import deflator is projected to stand at 4.0% in 2026, driven by higher energy commodity price pressures and higher AI goods prices, although dampened by the past appreciation of the euro and cheap imports from China. Import price growth is then projected to decline to 1.3% in 2028, reflecting an expected normalisation of global conditions.
3.1 Alternative energy price paths
Alternative paths for energy commodity prices suggest significant upside risks for inflation, especially in the short term. The staff projections are based on the technical assumptions outlined in Box 2. In this sensitivity analysis, risks are analysed using various percentiles of the option-implied neutral densities for both oil and gas prices.[24] A constant price sensitivity analysis is also carried out for both oil and gas prices (Chart 11). This exercise differs from the Middle East conflict scenarios presented in Box 4 in that only energy commodity prices are affected, whereas in the scenarios uncertainty also plays a role in the way the macroeconomic effects are evaluated.[25] The results are shown in Table 4.
Chart 11
Alternative paths for energy price assumptions
a) Oil price assumption
(USD/barrel)

b) Gas price assumption
(EUR/MWh)
Sources: Morningstar and ECB staff calculations. 
Note: Option-implied neutral densities for gas and oil prices are extracted from 19 August 2026 market quotes for options on ICE Brent crude oil and Dutch TTF natural gas futures with fixed quarterly expiry dates.
Table 4
Alternative energy price paths and their impact on real GDP growth and HICP inflation
(deviations from baseline levels, percentages; deviations from baseline growth rates, percentage points)
|
Oil prices |
Gas prices |
Synthetic energy price index |
Real GDP growth |
HICP inflation |
||
|---|---|---|---|---|---|---|
|
Path 1: 5th percentile |
2026 |
-10.6 |
-17.2 |
-13.0 |
0.0 |
-0.3 |
|
2027 |
-35.7 |
-39.3 |
-37.0 |
0.3 |
-1.2 |
|
|
2028 |
-40.3 |
-44.4 |
-41.5 |
0.6 |
-0.8 |
|
|
Path 2: 25th percentile |
2026 |
-4.8 |
-8.6 |
-6.2 |
0.0 |
-0.1 |
|
2027 |
-14.8 |
-19.1 |
-16.4 |
0.1 |
-0.5 |
|
|
2028 |
-15.5 |
-21.8 |
-17.4 |
0.2 |
-0.3 |
|
|
Path 3: 75th percentile |
2026 |
6.2 |
13.3 |
8.8 |
0.0 |
0.2 |
|
2027 |
17.7 |
27.9 |
21.4 |
-0.2 |
0.7 |
|
|
2028 |
17.7 |
30.6 |
21.5 |
-0.3 |
0.4 |
|
|
Path 4: 95th percentile |
2026 |
21.3 |
49.5 |
31.7 |
0.0 |
0.6 |
|
2027 |
58.6 |
106.4 |
76.0 |
-0.5 |
2.2 |
|
|
2028 |
59.0 |
107.5 |
73.5 |
-1.0 |
1.2 |
|
|
Path 5: constant prices |
2026 |
1.7 |
-6.1 |
-2.4 |
-0.1 |
0.0 |
|
2027 |
17.3 |
22.0 |
15.0 |
-0.2 |
0.5 |
|
|
2028 |
24.4 |
74.1 |
34.6 |
-0.3 |
0.8 |
Notes: In this sensitivity analysis, a synthetic energy price index that combines oil and gas futures prices is used. The various percentiles refer to the option-implied neutral densities for the oil and gas prices on 19 August 2026. The constant oil and gas prices take the respective value on the same date. The macroeconomic impacts are reported as the average results of a number of ECB and Eurosystem staff macroeconomic models. In some models, the large inflation response to an energy price increase leads, under the assumption of a fixed monetary policy, to a sizeable decline in real interest rates and a temporary expansionary demand effect, which attenuate the average GDP response in the short run.
3.2 Alternative exchange rate paths
Alternative paths for the exchange rate suggest the possibility of a further appreciation of the euro, especially over the medium term, and hence indicate some downside risks to growth and inflation. The technical assumptions for exchange rates in the baseline projections are held constant over the projection horizon. Alternative downside and upside paths are derived from the 25th and 75th percentiles of the option-implied neutral densities for the USD/EUR exchange rate on 19 August 2026, which were tilted towards an appreciation of the euro (Chart 12). This is possibly because market participants’ expectations regarding monetary policy in the euro area relative to the United States, as well as expectations regarding a possible resolution of the conflict in the Middle East, are supporting the euro. The impacts of the alternative paths, which also include a forward exchange rate path at the cut-off date, are assessed using ECB and Eurosystem staff macroeconomic models. Table 5 shows the average impact on output growth and inflation across these models.
Chart 12
Alternative paths for the USD/EUR exchange rate

Sources: Bloomberg and ECB staff calculations.
Notes: An increase implies an appreciation of the euro. The 25th and 75th percentiles refer to the option-implied neutral densities for the USD/EUR exchange rate on 19 August 2026.
Table 5
Impact of alternative exchange rate paths on real GDP growth and HICP inflation
(exchange rates; deviations from baseline levels, percentages; deviations from baseline growth rates, percentage points)
|
USD/EUR exchange rate |
USD/EUR exchange rate |
Real GDP growth |
HICP inflation |
||
|---|---|---|---|---|---|
|
Path 1: 25th percentile |
2026 |
1.16 |
-0.1 |
0.0 |
0.0 |
|
2027 |
1.14 |
-1.8 |
0.1 |
0.1 |
|
|
2028 |
1.12 |
-3.3 |
0.1 |
0.1 |
|
|
Path 2: 75th percentile |
2026 |
1.17 |
1.0 |
0.0 |
0.0 |
|
2027 |
1.23 |
6.0 |
-0.1 |
-0.2 |
|
|
2028 |
1.27 |
9.9 |
-0.2 |
-0.3 |
|
|
Path 3: forward exchange rate |
2026 |
1.17 |
0.5 |
0.0 |
0.0 |
|
2027 |
1.18 |
2.2 |
0.0 |
0.0 |
|
|
2028 |
1.20 |
3.4 |
-0.1 |
-0.1 |
Sources: Bloomberg and ECB staff calculations.
Notes: An increase implies an appreciation of the euro. The 25th and 75th percentiles refer to the option-implied neutral densities for the USD/EUR exchange rate on 19 August 2026. The macroeconomic impacts are reported as averages of a number of ECB and Eurosystem staff macroeconomic models.
Box 4
Alternative scenarios for the economic impact of the Middle East conflict[26]
The staff projections continue to be surrounded by high uncertainty related to the Middle East conflict, which is illustrated by alternative scenarios. The scenarios presented below follow the same methodological approaches as those included in the June 2026 staff projections.[27] They assume alternative paths for energy commodity prices and differing propagation of those price developments to the euro area economy compared with the baseline. The scenarios also contain effects from uncertainty, financial amplification and international spillovers (Table A). The staff do not assign any probabilities to these scenarios, which rather serve to illustrate the key uncertainties relating to the impact of the conflict. In the context of large shocks, non-linearities and indirect and second-round effects can be important in the transmission of developments to inflation, as examined in detail in the June 2026 staff projections.[28] The following analysis largely keeps the strength of such effects unchanged from that exercise, except for indirect effects of energy prices on food inflation, which have been slightly reduced. Additionally, a sensitivity analysis around the severe scenario is conducted to investigate the implications of jet fuel shortages.
Table A
Narrative of the baseline and alternative scenarios regarding the conflict in the Middle East
|
Scenario |
Energy commodity prices |
Uncertainty |
Indirect and second-round effects on inflation |
Fiscal and monetary policy response in the euro area |
|---|---|---|---|---|
|
Baseline |
Energy commodity prices follow the technical assumptions.1 |
In line with observed developments in the VIX volatility index |
Limited upward judgement to account for possibly larger impacts than with the standard model elasticities due to the size of the energy shock |
Short-term interest rates follow the technical assumptions.1 Only fiscal policies legislated or announced and well-specified policies are taken into account. |
|
Milder scenario |
Energy commodity prices follow the 25th percentile of the market-implied probability distributions.1 |
Unchanged compared with the baseline |
Unchanged compared with the baseline |
Unchanged compared with the baseline |
|
Adverse scenario |
Energy commodity prices follow the 75th percentile of the market-implied probability distributions.1 |
The VIX rises by about |
Stronger calibration than in the baseline based on 2021-24 inflation dynamics and satellite models |
Unchanged compared with the baseline |
|
Severe scenario |
Energy commodity prices follow the 95th percentile of the market-implied probability distributions.1 |
The VIX rises by about |
Stronger calibration than in the adverse scenario based on 2021-24 inflation dynamics and satellite models |
Unchanged compared with the baseline |
1) Technical assumptions and market-implied probability distributions have a cut-off date of 19 August 2026.
1. Assumptions on energy commodity prices
The alternative scenarios use distributions derived from option-implied densities to define alternative paths for oil and gas prices. It is assumed that from the fourth quarter of 2026 oil and gas prices follow the 25th percentile of the market-based distributions in the milder scenario, the 75th percentile in the adverse scenario and the 95th percentile in the severe scenario (Chart A, panels a and b, and Table B). These percentiles provide a market-based assessment of the current risks surrounding energy prices and implicitly cover alternative evolutions of the conflict in the Middle East and its implications for energy supply disruptions.
- In the milder scenario, oil prices drop to around USD 75 per barrel and gas prices to €50 per MWh in the fourth quarter of 2026. This path likely reflects market views that the conflict could still be resolved very swiftly, leading to a rapid normalisation of global oil and gas markets.
- In the adverse scenario, oil prices increase to around USD 100 per barrel and gas prices to €75 per MWh in the fourth quarter of 2026. They remain substantially above the baseline levels throughout the horizon, likely reflecting market expectations of a more prolonged conflict than assumed in the baseline scenario.
- In the severe scenario, oil prices rise by 50% and gas prices more than double relative to the baseline, reaching around USD 130 per barrel and €130 per MWh respectively in the fourth quarter of 2026 (compared with USD 88 per barrel and €60 per MWh in the baseline in the same quarter). The shocks are also highly persistent, with deviations from the baseline having a similar magnitude at the end of the projection horizon. The energy price paths derived from option-implied densities can be translated into supply disruptions using price elasticities to supply shocks. The severe scenario would broadly correspond to a reduction of the global supply of oil by around 8% and a reduction of the supply of liquefied natural gas (LNG) by 12% relative to the baseline (equivalent to about 8 million barrels per day of oil and 5 billion cubic metres per month of LNG, Chart A, panels c and d).[29] In this severe scenario, European gas prices would also rise well above the €65 per MWh threshold. Based on previous price-spike episodes, this is the price level above which Europe would be able to outbid Asia for LNG cargoes, thereby limiting the extent of gas supply disruptions in the euro area.
Chart A
Assumptions for the paths of oil and European natural gas prices
|
a) Oil prices |
b) Gas prices |
|
(USD per barrel) |
(EUR per MWh) |
 |
 |
|
c) Oil prices |
d) Gas prices |
|
(USD per barrel) |
(EUR per MWh) |
 |
 |
Sources: Refinitiv and ECB staff calculations.
Notes: The cut-off date for the September 2026 baseline assumptions is 19 August 2026. The oil supply loss scenario is based on the elasticity of the oil price to oil supply shocks as estimated in Caldara et al. (2019)*, while the gas supply loss scenario is based on the elasticity of the gas price to gas supply shocks as estimated in Albrizio et al. (2023)**.
* Caldara, D., Cavallo, M. and Iacoviello, M. (2019), “Oil price elasticities and oil price fluctuations”, Journal of Monetary Economics, Vol. 103, May, pp. 1-20.
** Albrizio, S., Bluedorn, J., Koch, C., Pescatori, A. and Stuermer, M. (2023), “Sectoral Shocks and the Role of Market Integration: The Case of Natural Gas”, AEA Papers and Proceedings, Vol. 113, American Economic Association, Nashville, May, pp. 43-46.
Table B
Energy commodity price scenarios – levels and deviations from the baseline
|
Scenario |
Q4 2026 (USD per barrel or EUR per MWh) |
Q4 2026 (% deviation from baseline) |
Q4 2028 (USD per barrel or EUR per MWh) |
Q4 2028 (% deviation from baseline) |
|
|---|---|---|---|---|---|
|
Milder |
Oil prices |
76 |
-12% |
62 |
-15% |
|
Gas prices |
50 |
-17% |
22 |
-22% |
|
|
Adverse |
Oil prices |
99 |
15% |
84 |
16% |
|
Gas prices |
77 |
28% |
38 |
33% |
|
|
Severe |
Oil prices |
132 |
53% |
115 |
58% |
|
Gas prices |
130 |
116% |
61 |
114% |
Source: ECB and ECB staff calculations.
2. Assumptions on uncertainty and its transmission to financing conditions
The adverse and severe scenarios assume that an escalation of the Middle East conflict would increase global uncertainty and trigger repricing in financial markets. The VIX index is used as a proxy for global uncertainty. It is assumed to spike temporarily in the adverse scenario, and in the severe scenario the spike is assumed to be higher and more persistent. These assumptions are broadly consistent with episodes of comparable geopolitical tensions observed in the past, including at the beginning of Russia’s war against Ukraine and the conflict in the Middle East in October 2023 (Chart B, panel a). Uncertainty affects the economy in the scenarios in two ways: directly, via its impact on real GDP in the form of confidence shocks, and indirectly through financing conditions, with both effects weighing on consumption, investment and trade.
Chart B
Assumptions for the VIX index and impact on selected financial variables
a) VIX assumptions
(index)

b) Lending spreads for firms and for households for house purchase under the adverse and severe scenarios
(basis points, deviations from baseline)
Sources: ECB, CBOE Global Markets and ECB staff calculations. 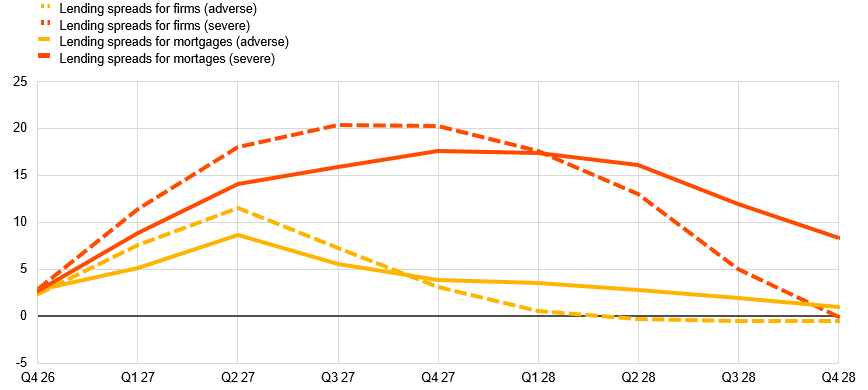
Notes: In panel a), the blue line shows an unconditional forecast path from a Bayesian vector autoregressive (BVAR) model. The model includes the VIX index, euro area GDP, private consumption, business investment, HICP inflation and short-term interest rates. The VIX index is used as the uncertainty measure since it serves as a direct input into the financial model in panel b). In panel b), the spreads are forecast using a mixed frequency daily-monthly Markov-switching BVAR model conditioned on the paths of the VIX index in the scenarios. The model includes the VIX index, equities of both banks and corporations, bank bond spreads, the lending spreads for both households and firms, and both short and long-term market rates from the projections, and distinguishes between high and low volatility states, with different estimated pass-throughs. The latest observation for the VIX index is for 19 August 2026.
In the adverse scenario the increase in lending spreads is shorter-lived and less pronounced than in the severe scenario, reflecting differences in the VIX paths (Chart B, panel b). In the adverse scenario, lending spreads (over the risk-free rate) rise only modestly, peaking at around 10 basis points in the second quarter of 2027 for both loans to firms and mortgages, as the model predicts a rapid return to the low volatility state. Spreads on loans to firms peak slightly higher but also return to baseline faster than mortgage spreads. In the severe scenario, the greater persistence of elevated volatility exhausts banks’ buffering capacity, so spreads rise more than proportionally with respect to the VIX, peaking at around 20 basis points in the second half of 2027. Mortgage spreads peak one quarter later and stay above the baseline until the end of the horizon.
3. Macroeconomic implications for the international environment
Given limited direct trade links with the region affected by the conflict, the main channels for transmission of the shock to the global economy are assumed to be heightened uncertainty, as well as direct and indirect effects of higher energy and food prices (Chart C). In the scenarios, heightened global uncertainty lowers global asset prices, tightens global financing conditions, and weakens global spending and trade. Higher oil and gas prices increase import costs, reduce real incomes and weigh most heavily on energy-importing economies. Rising energy costs also push up food prices, raising inflation and further dampening global demand.[30]
In the milder scenario, the faster than anticipated resolution of the disruptions implies growth being higher and inflation being lower than in the global baseline projection. As energy prices decline more quickly, the inflationary impulse fades faster, uncertainty recedes, financing conditions normalise and foreign demand is stronger as a result of a more supportive external environment than in the baseline.
In the adverse scenario, the global economy is hit by a moderate but persistent negative supply shock. Global GDP growth is below the baseline throughout the projection horizon.[31] The lowest growth of around 0.2 percentage points below the baseline is in 2027, while inflation is 0.8 and 0.4 percentage points above the baseline in 2027 and 2028 respectively. For the euro area, the nominal effective exchange rate weakens slightly before normalising, while foreign demand falls each year further from the baseline level and is about 0.8% below the baseline at the end of the horizon.
Chart C
Impact on the global economy excluding the euro area
(percentage point deviations from baseline growth rate)
Sources: ECB staff calculations based on ECB-GLOBAL model simulations.
Note: The simulations are conducted using a forecast setting with the ECB-GLOBAL model in which euro area monetary policy is exogenous.
In the severe scenario, the negative supply shock is much larger and has more persistent effects. As a result, the inflationary impulse from energy and food commodity prices is stronger and global uncertainty rises more sharply. Global GDP growth is only marginally affected in 2026 but is dampened by 1 percentage point in 2027, with small effects in 2028. Inflation is above the baseline, by around 0.4 percentage points in 2026. The effect peaks at almost 2.7 percentage points in 2027, before moderating to 1.1 percentage points in 2028. For the euro area, the nominal effective exchange rate weakens initially and then normalises, while foreign demand falls each year further from the baseline level, eventually reaching around 2.9% below the baseline in 2028.
4. Macroeconomic implications for the euro area
The results for the euro area have been derived using broadly the same assumptions for the strength of direct, indirect and second-round effects as in the June scenarios, but with slightly reduced indirect effects on food prices. The previously assumed direct effects in the severe scenario, i.e. the degree of pass-through of energy prices to HICP energy inflation, have been cross-checked and confirmed using a granular energy inflation model.[32] The scenario evaluation also largely keeps the previous modifications to transmission in the core projection model, which resulted in stronger indirect and second-round effects. The only difference from previously used calibrations relates to the pass-through of energy prices to food prices. These indirect effects have been slightly reduced in all scenarios, while remaining significantly stronger than the standard elasticities in the adverse and severe scenarios.[33]
In the milder scenario, GDP growth is slightly stronger, and inflation moderates faster than in the baseline (Table C and Chart D). As energy price increases unwind more rapidly in this scenario than in the baseline assumptions, inflation falls below the baseline level in 2027 and 2028. Lower energy prices also benefit GDP growth, with real growth settling above the baseline at 1.5% in 2027 and 1.6% in 2028.
In the adverse scenario, the shock leads to a persistent upward shift in energy prices, implying more prolonged inflationary pressures, while GDP growth is weakened in the short term. Real GDP growth drops below the baseline, to 1.1% in 2027, returning to 1.4% in 2028 as energy prices fall and uncertainty unwinds. HICP inflation would rise in this scenario to 3.1% in 2026 and remain elevated at 3.2% in 2027, before falling to 2.3% in 2028. Core inflation (i.e. inflation excluding energy and food) would peak in 2027, at 2.8%, reflecting the gradual unfolding of indirect and second-round effects across prices and wages, and fall to 2.4% in 2028.
The severe scenario would imply a substantially more challenging macroeconomic environment, driven by stronger and more persistent commodity price shocks together with amplified indirect and second-round effects. Real GDP growth would be 0.8% in 2026, falling markedly to 0.4% in 2027, indicating prolonged weakness in activity. It would recover to 1.4% in 2028. Headline inflation would increase sharply, reaching 3.3% in 2026 and peaking at 5.4% in 2027. Core inflation would rise substantially, with higher energy prices increasingly feeding through to domestic prices and wages.
Table C
Key euro area variables under the baseline and alternative scenarios
(annual percentage changes)
|
|
Real GDP growth |
HICP inflation |
HICP inflation excluding energy and food |
|||||||
|---|---|---|---|---|---|---|---|---|---|---|
|
2026 |
2027 |
2028 |
2026 |
2027 |
2028 |
2026 |
2027 |
2028 |
||
|
September 2026 baseline |
0.9 |
1.4 |
1.5 |
3.0 |
2.5 |
2.1 |
2.5 |
2.6 |
2.3 |
|
|
Milder scenario |
0.9 |
1.5 |
1.6 |
2.9 |
1.9 |
1.8 |
2.5 |
2.5 |
2.2 |
|
|
Adverse scenario |
0.9 |
1.1 |
1.4 |
3.1 |
3.2 |
2.3 |
2.5 |
2.8 |
2.4 |
|
|
Severe scenario |
0.8 |
0.4 |
1.4 |
3.3 |
5.4 |
3.2 |
2.5 |
3.5 |
3.2 |
|
Source: ECB staff calculations based on ECB-BASE model simulations.
The negative macroeconomic effects of the adverse and severe scenarios initially stem mainly from higher energy costs and uncertainty, but over time arise increasingly through broader spillovers to trade, domestic demand and core inflation. Chart E shows that the deterioration in real GDP growth primarily reflects higher energy prices, increased uncertainty and weaker trade. In 2027 the slowdown becomes more pronounced as weaker global demand – in part linked to higher food and energy prices internationally – further weighs on euro area exports, while higher energy prices and tighter financing conditions place an additional drag on domestic demand. By 2028 GDP growth gradually normalises, as energy price pressures fade and wages catch up to some extent after the initial decline in real incomes. As regards inflation, the main transmission channel is higher energy costs, which exert direct effects on energy inflation and raise production costs for non-energy products. In the severe scenario, stronger indirect and second-round effects increasingly feed through to food and core inflation, leading to substantially more persistent headline inflation. In the milder scenario, lower inflation than in the baseline, largely driven by lower energy prices, supports real incomes, consumption spending and therefore GDP growth, which is further boosted by a more favourable external environment.
Chart D
Baseline and alternative scenarios for key euro area variables
Real GDP
(quarter-on-quarter percentage changes)

|
HICP |
HICPX |
|
(annual percentage changes) |
(annual percentage changes) |
 |
 |
|
HICP energy |
HICP food |
|
(annual percentage changes) |
(annual percentage changes) |
 |
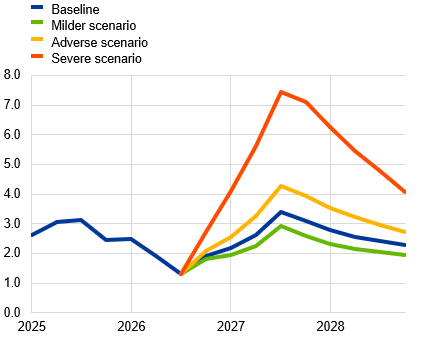 |
Source: ECB staff calculations.
Chart E
Impact on the euro area economy by channel or component across scenarios
a) Real GDP, by channel
(percentage point deviations from baseline growth rate)
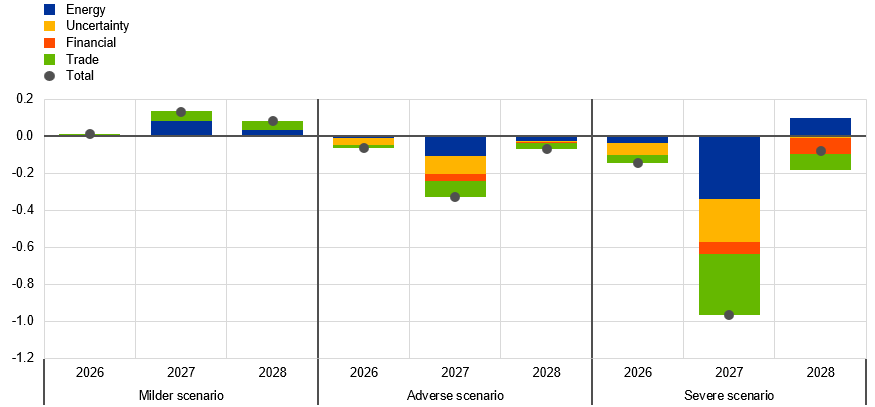
b) HICP inflation, by channel
(percentage point deviations from baseline growth rate)

c) HICP inflation, by component
(percentage point deviations from baseline growth rate)
Source: ECB staff calculations based on ECB-BASE model simulations. 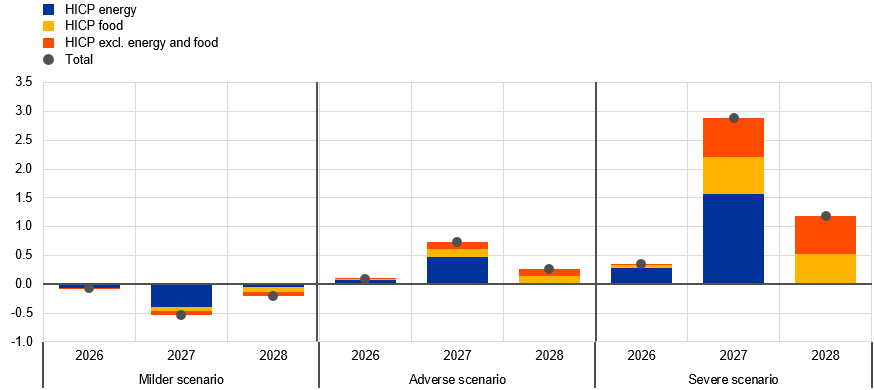
Note: Simulations are conducted under a forecast setting using the ECB-BASE model with exogenous euro area monetary policy.
5. Sensitivity analysis around the severe scenario: jet fuel shortages
In the event of extreme jet fuel shortages, global air transport services could fall by 50%.[34] According to a multi-country, multi-sector dynamic stochastic general equilibrium model with global production networks, such disruptions to air transport would lower euro area GDP growth by about 0.1 percentage points in 2027 and increase inflation by around 0.15 percentage points in 2027 and by 0.2 percentage points in 2028 (Chart F). The model assumes that replacing air transport with other transport methods would be difficult, especially for international travel and time-sensitive goods.
Chart F
Sensitivity analysis: impact of jet fuel shortages in addition to the severe scenario
|
Real GDP growth |
HICP inflation |
|
(percentage point deviations from severe scenario growth rate) |
(percentage point deviations from severe scenario growth rate) |
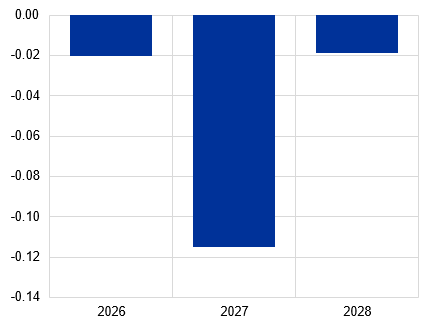 |
 |
Source: ECB staff calculations based on the ONKIO-MCMS model, see Aguilar, P., Domínguez-Díaz, R., Gallegos, J. E. and Quintana, J. (2026), “The Transmission of Foreign Shocks in a Networked Economy,” Banco de España Working Paper No 2607.
6. Caveats to the scenario analyses
These scenario analyses do not include any monetary or fiscal policy responses, which would mitigate the inflation impacts, or other channels that could affect the macroeconomic implications. As is the standard convention for scenario analyses in the staff projections, the scenarios assume that monetary and fiscal policy are unchanged compared with the baseline. The significant increases in inflation, especially under the severe scenario, would likely be partly offset by tighter monetary policy or fiscal support measures which could lower consumer energy prices – as was seen in the 2022-24 episode of high inflation. Other channels not explicitly included in the analyses are for example possible positive impacts on tourism in euro area countries from reduced tourism in the Middle East.
Box 5
Comparison with forecasts by other institutions and the private sector
The September 2026 ECB staff projections for both growth and inflation are at the top of or above the range of forecasts from other institutions and surveys of private sector forecasters. The ECB staff projections for growth are at the top of the range of other forecasts for 2026, and above the range for 2027-28 – probably partly owing to the incorporation of recent positive data outturns. For inflation, the staff projections are at the top of the range of other forecasts for 2026 and above the range for 2027-28, with all forecasts covered suggesting a return of inflation close to target in the medium term.
Table A
Comparison of recent forecasts for euro area real GDP growth, HICP inflation and HICP inflation excluding energy and food
(annual percentage changes)
|
|
Date of release |
GDP growth |
HICP inflation |
HICP inflation excluding energy and food |
||||||
|---|---|---|---|---|---|---|---|---|---|---|
|
2026 |
2027 |
2028 |
2026 |
2027 |
2028 |
2026 |
2027 |
2028 |
||
|
ECB staff projections |
September 2026 |
0.9 |
1.4 |
1.5 |
3.0 |
2.5 |
2.1 |
2.5 |
2.6 |
2.3 |
|
Consensus Economics |
August 2026 |
0.7 |
1.2 |
1.3 |
2.8 |
2.3 |
2.0 |
2.4 |
2.4 |
– |
|
Survey of Professional Forecasters |
July 2026 |
0.6 |
1.2 |
1.3 |
2.7 |
2.2 |
2.0 |
2.4 |
2.2 |
2.1 |
|
International Monetary Fund |
July 2026 |
0.9 |
1.2 |
– |
2.9 |
2.3 |
– |
– |
– |
– |
|
OECD |
June 2026 |
0.8 |
1.2 |
– |
2.8 |
2.4 |
– |
2.4 |
2.4 |
– |
|
European Commission |
May 2026 |
0.9 |
1.2 |
– |
3.0 |
2.3 |
– |
2.3 |
2.5 |
– |
Sources: Consensus Economics Forecasts, 13 August 2026 (data for 2028 are taken from the July 2026 survey); ECB Survey of Professional Forecasters, 24 July 2026; IMF World Economic Outlook, 8 July 2026; OECD Economic Outlook, 3 June 2026; and European Commission Spring 2026 Economic Forecast, 21 May 2026.
Notes: These forecasts are not directly comparable with one another or with the ECB staff macroeconomic projections, as they were finalised at different points in time. Additionally, they use different methods to derive assumptions for fiscal, financial and external variables, including oil, gas and other commodity prices. The ECB staff macroeconomic projections report working day-adjusted annual growth rates for real GDP, whereas the European Commission and the International Monetary Fund report annual growth rates that are not adjusted for the number of working days per annum. Other forecasts do not specify whether they report working day-adjusted or non-working day-adjusted data.
© European Central Bank, 2026
Postal address 60640 Frankfurt am Main, Germany
Telephone +49 69 1344 0
Website www.ecb.europa.eu
All rights reserved. Reproduction for educational and non-commercial purposes is permitted provided that the source is acknowledged.
For specific terminology please refer to the ECB glossary (available in English only).
PDF ISBN 978-92-899-7804-0, ISSN 2529-4466, doi:10.2866/3506293, QB-01-26-091-EN-N
HTML ISBN 978-92-899-7803-3, ISSN 2529-4466, doi:10.2866/3711349, QB-01-26-091-EN-Q