
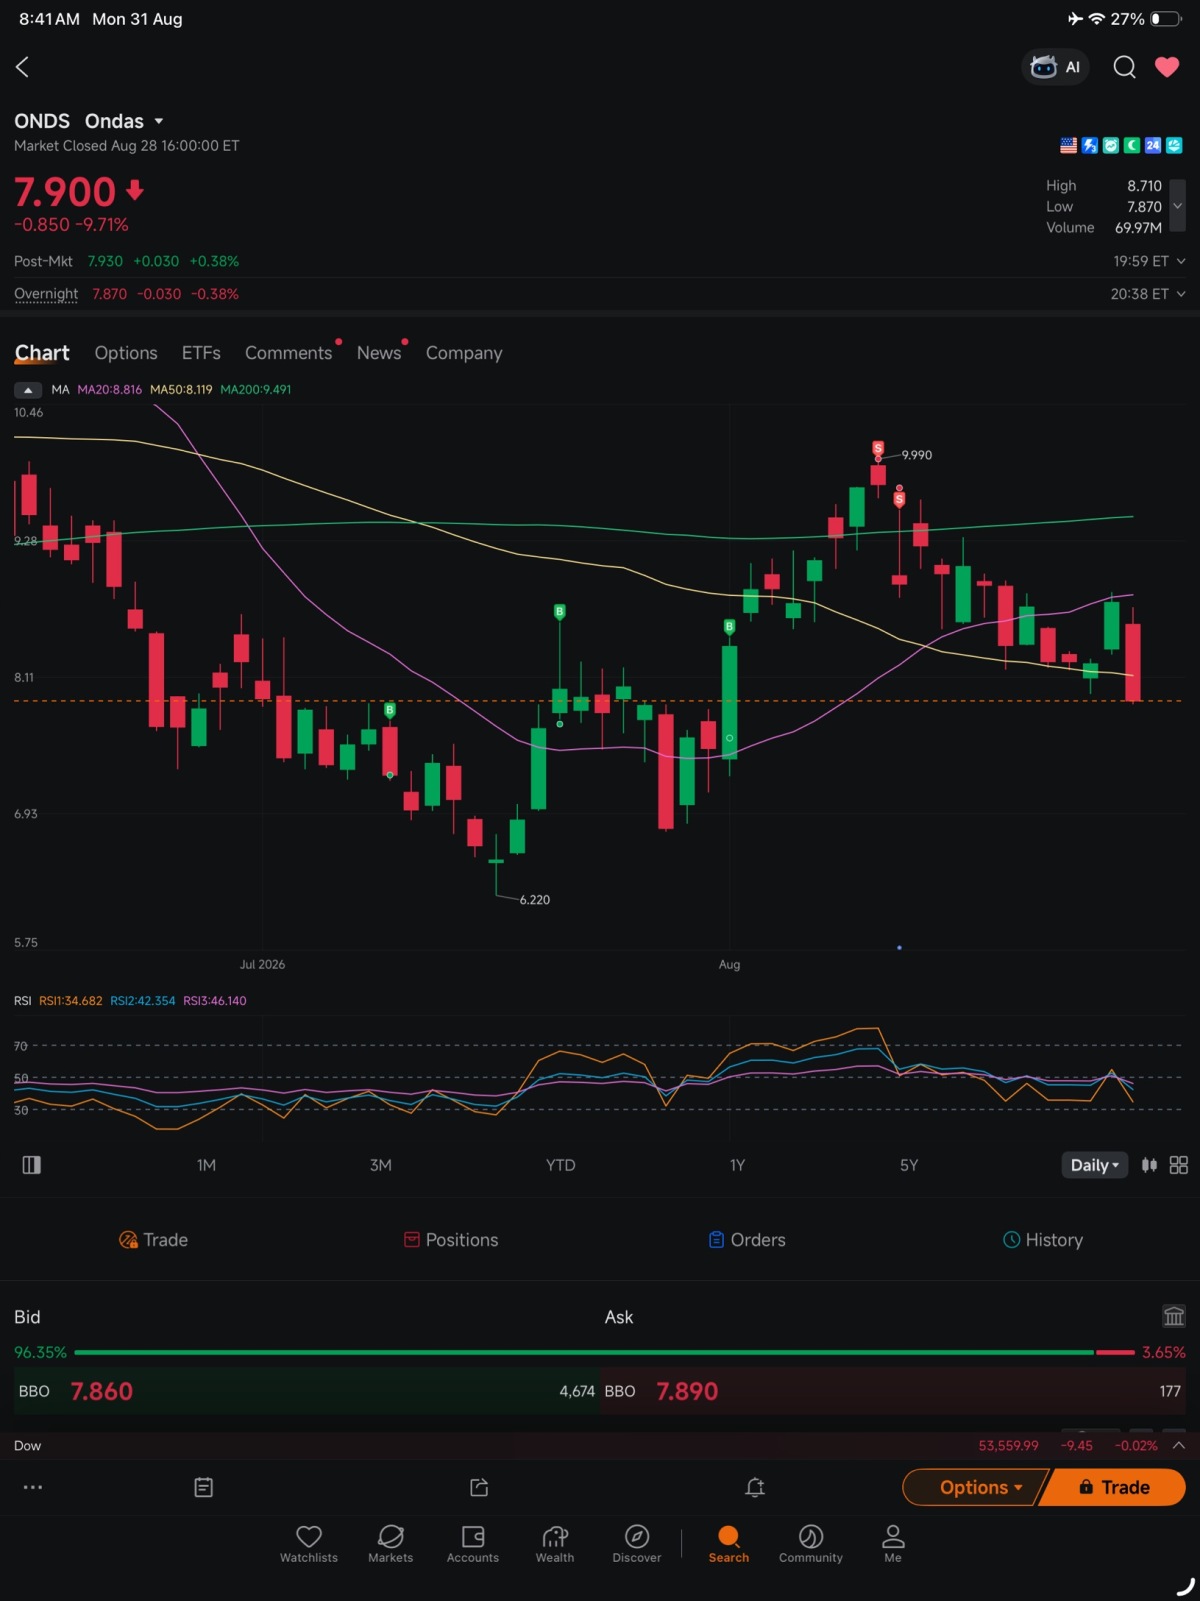
📌 Trade Overview:
Ticker: $ONDS (Ondas Holdings)
Latest Price: $7.900 (-9.71%)
Trading Style: Technical Swing Trading / Mean Reversion Strategy
💡 1. Buy & Sell Logic:
Buy Rationale: After hitting a阶段性 low of $6.22, $ONDS formed a strong support base in the $7.00 – $7.50 demand zone. The confluence of an oversold bounce on the RSI and the MA50 moving average offered an excellent risk-reward ratio, triggering my staggered buy (B) signal.
Reason for Selling: As the stock price staged a strong rebound approaching the significant resistance level of the 200-day moving average (MA200, approx. $9.491), signs of weakening upward momentum emerged near the $9.90 high. To lock in profits, I executed a precise sell order to take profit near the local peak of $9.99.
🎯 2. Trading Strategy and Risk Control:
Swing Trading in a Volatile Market: Amid heightened volatility in the broader market and during earnings season, chasing highs can easily lead to being trapped. My strategy is to accumulate positions at lows near key support zones and take profits in tranches at moving average resistance levels on rallies.
Key Technical Indicators: Primary references include the MA20 ($8.816), MA50 ($8.119), MA200 ($9.491), and the RSI momentum indicator.
Risk Management Principles: Strictly adhere to trailing stops. Never allow a profitable swing trade to turn into a loss in a volatile market.
🔮 3. Review Summary and Future Outlook:
The stock recently pulled back 9.71% in a single day to $7.90, underscoring the importance of locking in profits promptly in high-resistance zones. Going forward, I will closely monitor whether the price can stabilize in the $7.50–$7.80 range with shrinking volume on the retest. If a higher low structure forms, I will consider looking for low-risk entry opportunities again.