
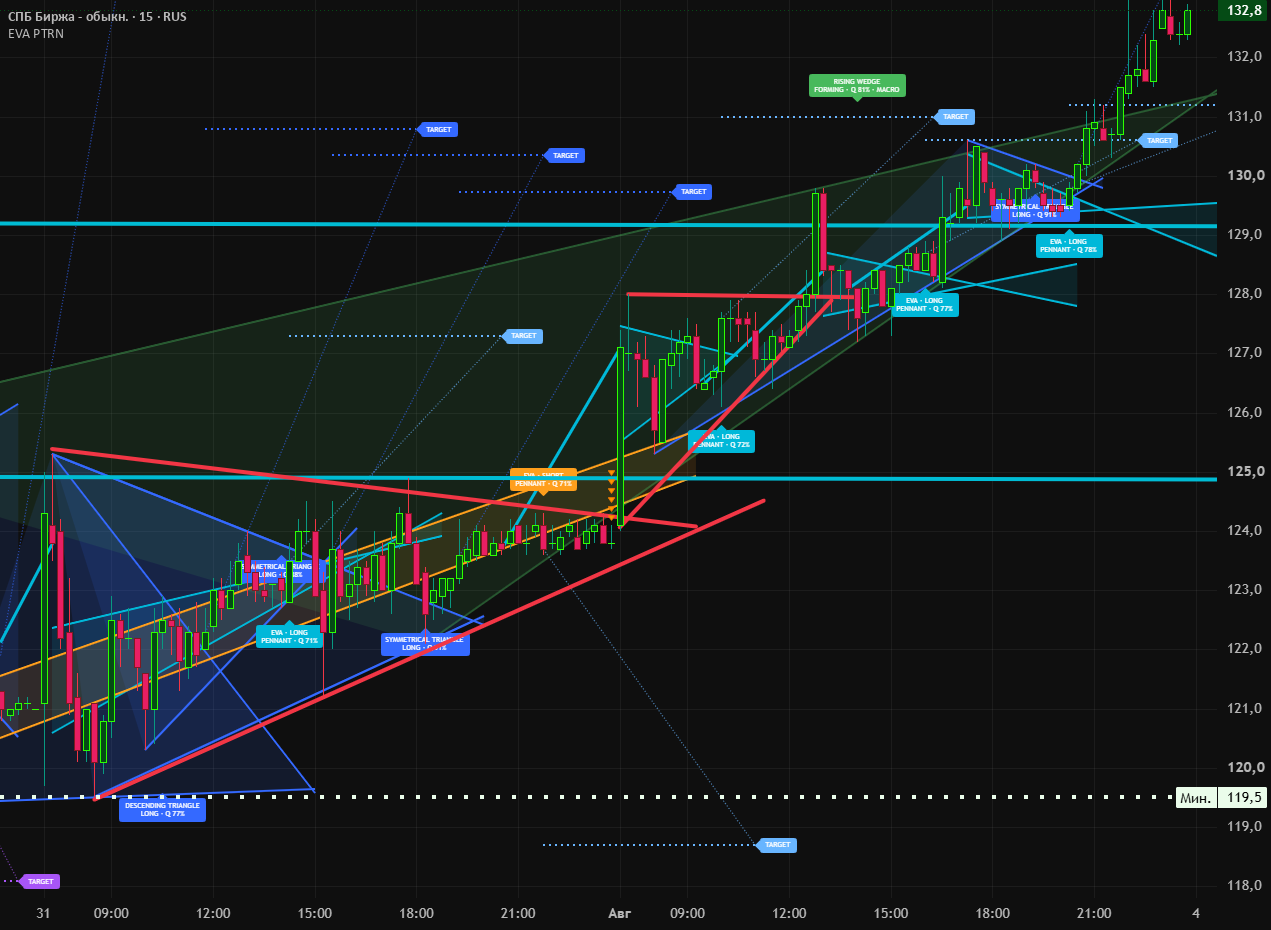
Instead of manually searching through hundreds of candles, the indicator continuously analyzes market structure, confirmed pivot points, volatility, pattern geometry, volume behavior and breakout conditions.
The result is a clean visual map of developing and confirmed trading setups.
🔍 PATTERNS DETECTED
The indicator automatically identifies:
• Bull Flags and Bear Flags
• Bullish and Bearish Pennants
• Symmetrical Triangles
• Ascending Triangles
• Descending Triangles
• Rising Wedges
• Falling Wedges
• Double Bottom patterns
• Double Top patterns
• Head and Shoulders
• Inverse Head and Shoulders
Both local MICRO patterns and larger MACRO market structures can be detected.
⚡ INTELLIGENT PATTERN SCANNING
EVA AI does not rely on one fixed pattern length.
The scanner evaluates multiple market windows and compares available structures by geometry, compression, trend context, pole strength, volatility and overall pattern quality.
This adaptive approach allows the indicator to detect compact intraday formations as well as larger swing trading patterns.
When two independent structures exist at the same time, the indicator can display both instead of hiding one valid setup behind another.
📐 PREMIUM CHART VISUALIZATION
Developing patterns are displayed directly on the chart with projected boundaries and optional transparent pattern zones.
Confirmed patterns become brighter after a valid closed-candle breakout.
Depending on the detected structure, the chart may display:
• Pattern boundaries
• Pivot point labels
• Neckline levels
• Calculated apex projections
• LONG or SHORT breakout labels
• Pattern quality score
• MICRO or MACRO classification
• Measured price targets
• Target guide lines
Every pattern family has its own visual style and color, making complex market structure easier to read.
🎯 CLOSED-CANDLE BREAKOUT CONFIRMATION
LONG and SHORT signals are generated only after the required breakout has been confirmed on a closed candle.
The script does not use lookahead, future market data or historical signal backfilling.
This means a confirmed signal is fixed on the candle where the breakout condition is actually validated rather than being drawn retrospectively on an earlier candle.
📊 PATTERN QUALITY FILTER
Every detected structure receives an internal quality score from 0 to 100.
The score evaluates factors such as:
• Pattern geometry
• Price compression
• Strength of the preceding movement
• Pattern proportions
• Pivot symmetry
• Breakout candle strength
• Volume behavior
• MICRO or MACRO structure priority
Separate quality thresholds are available for developing patterns and confirmed trading signals.
Raise the threshold to receive fewer but more selective setups. Lower it to increase pattern coverage.
📈 VOLUME AND BREAKOUT FILTERS
Optional volume filters can be used to evaluate consolidation volume and breakout activity.
Traders can choose whether volume should contribute to the quality score or become a strict confirmation requirement.
This makes the indicator adaptable to stocks, cryptocurrency, forex, futures, indices and other liquid markets.
🧠 REVERSAL PATTERN ENGINE
Double Top, Double Bottom, Head and Shoulders and Inverse Head and Shoulders patterns are analyzed through confirmed pivot sequences.
The engine evaluates:
• Distance between pattern points
• Relative height and depth
• Time symmetry
• Shoulder proportions
• Head dominance
• Neckline slope
• Prior directional price movement
• Breakout candle body
• Pattern lifetime
A separate MACRO pivot stream helps detect large reversal structures that may otherwise be hidden by smaller market noise.
🔺 TRIANGLE AND WEDGE DETECTOR
Triangles and wedges are selected from multiple pivot combinations rather than only the most recent four turning points.
The scanner compares slope direction, boundary convergence, initial pattern height, final compression and projected apex distance.
This improves the detection of larger chart formations while filtering weak or geometrically invalid structures.
🛠 FLEXIBLE SETTINGS
The indicator includes detailed controls for:
• Minimum and maximum pattern length
• Pivot sensitivity
• MICRO and MACRO pattern detection
• Pattern quality thresholds
• Breakout confirmation buffer
• Breakout candle strength
• Volume confirmation
• Pattern projection length
• Target calculation
• Pattern colors and transparency
• Maximum number of displayed structures
• Signal cooldown
• Developing pattern visibility
Default settings are balanced for general chart analysis, while experienced traders can create stricter profiles for scalping, day trading or swing trading.
💡 HOW TO USE
1. Add the indicator to a standard candlestick chart.
2. Watch the developing structure and its projected boundaries.
3. Check the pattern type, direction and quality score.
4. Wait for a confirmed closed-candle breakout.
5. Use the calculated target as a technical reference.
6. Confirm the setup with trend direction, liquidity, support and resistance, volume and personal risk management.
The indicator can be used as a chart pattern scanner, breakout indicator, price action tool, market structure detector and technical analysis assistant.
It is suitable for traders working with crypto, forex, stocks, futures and indices across intraday and higher timeframes.
⚠️ IMPORTANT
This indicator is an analytical tool. It does not guarantee profitable trades and should not be treated as financial advice.
Always evaluate market conditions, liquidity, volatility and risk before entering a position.
🚀 NEED A COMPLETE TRADING INDICATOR?
EVA AI+ combines market structure, liquidity zones, trend analysis, momentum confirmation and high-quality LONG/SHORT signals in one advanced trading system.
The indicator helps traders read market direction, locate liquidity, identify potential entries and manage trades with clearly structured Take Profit, Stop Loss and trailing logic.
✅ Stocks, Crypto, Forex and Futures
✅ Intraday and Swing Trading
✅ Market Structure and Liquidity Analysis
✅ LONG and SHORT Trading Signals
✅ Free Test Drive Available
🔥 Get EVA AI+ and request your FREE TEST DRIVE:
