
Learn an ES gap fill strategy that returned 44% in the last 3 months on a $10,000 account with a 71% win rate. It is simple and can be fully automated.
This article was originally published on May 10, 2026. I have kept the orginal article intact, but will add updates on strategy over time at the bottom of the article.
Small Gaps on ES (or MES) fill a high percentage of the time. Large gaps do not. This may change over time, so it is important to stay on top of the statistics. The strategy/idea will likely remain profitable, but the parameters of the strategy (the exact settings used) may change over time.
Run statistics for this strategy on Edgeful, or manually test using a chart to see what is working.
Using Edgeful data, we can see that over the last six months, gaps between 0.05% and 0.2% fill 88% of the time for both gaps up and down on ES.

That’s a high statistic and could be worth capitalizing on.
Edgeful algos can automate this strategy and can also backtest it. Over the prior three months, the strategy produced 14 trades, with 10 of them winners (71%). The total return was 44% or $4,387.5 on a $10,000 account. Maximum drawdown over the period was 8.53%.
The largest losing trade was $512, but could theoretically be slightly bigger (the Edgeful algo also allows for setting a maximum loss per trade). Such losses represent a high percentage of the account (5%); therefore, using an account larger than $10,000 is recommended while still trading one contract. A $20,000 account would reduce that loss to 2.5% of the account, but the percentage profit would also be cut in half (dollar profit would remain the same).

The ES Gap Fill Stratetgy Settings
- Max Loss Per Trade: $600
- Gap fill target/exit: 100% (meaning: exit at the prior close)
- Risk to reward: 1 (overridden by max loss, if applicable)
- Min gap size: 0.05%
- Max gap size: 0.2%
- All weekdays
- Trade both gap ups and gap downs
- Enter on Close (5-minute opening candle close)
The max gap size of 0.2 was chosen because larger gaps have a much lower chance of filling. The min gap size was chosen because we need at least a small gap to fill.
Gap fill % can be altered to get a higher win rate (fill less than 100% of the gap) or bigger potential profit (fill greater than 100% of the gap.
The reward:risk could also be altered, but will affect results.
The main statistic to run on Edgeful is the Gap Fill report and the By Size subreport. This tells you what size gaps are filling at a high percentage. The gap size that is working now may not be the same size that is optimal in the future. Check and update regularly.
The ES Gap Fill Strategy
A gap fill is when the price opens away from the prior close and then moves back to touch that prior close price within the session.
This strategy enters a trade on the close of the opening 5-minute candle.
Enter in the direction of a gap fill.
A maximum loss was set at $600 or 12 points per contract.
Gaps between 0.05 and 0.2% are traded. BUT profit could be more or less than this, since the opening 5-minute candle of the day will affect the entry point. For example, the largest win within this sample was $1212.50, or more than 24 points.
If the gap is filled by the opening candle, no trade is taken.
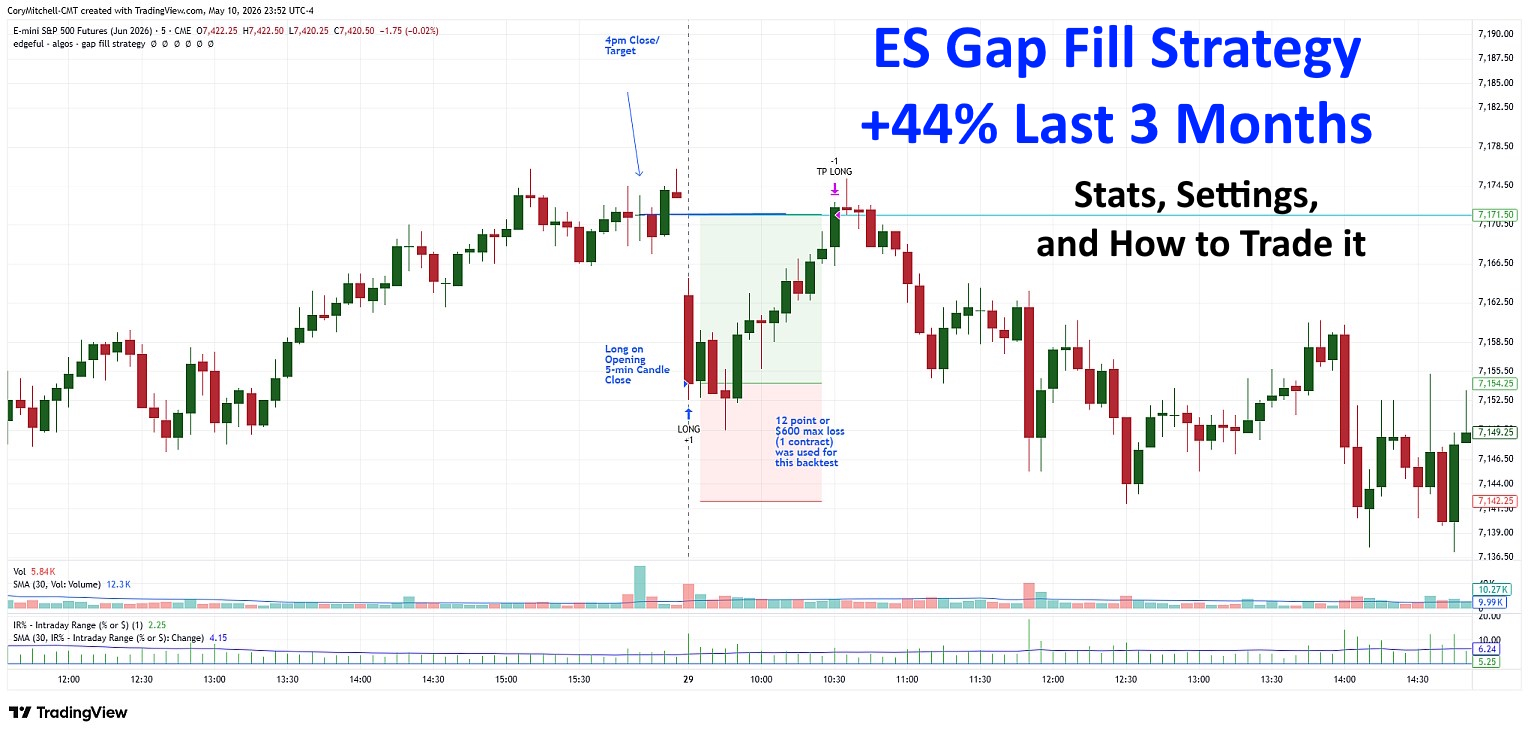
The chart shows a trade from April 29 in the June 2026 ES contract.

A long trade is taken at the close of the opening 5-minute candle. It is a long because that is the direction the price has to move if it is to fill the gap.
A stop loss is placed 12 points from the actual entry point.
The target is the 4 pm closing price of the prior session (on the chart above, the chart shows price action until 415 pm…but the 4 pm close is one we want to use).
This trade made $862.5, less commissions, or 17.25 points.
That’s It
Just because this can be automated doesn’t mean set it and forget it forever. Stay on top of what settings are working so you can get the most out of the strategy.
Over time, different risk/rewards, max losses, or gap sizes may work better. Sometimes, if gaps are filled a low percentage of the time, it may be best to avoid the strategy.
Use Edgeful to track the data and update the strategy accordingly.
Food for thought. Take what you like and leave the rest.
June 21, 2026
Since the last update, May 10, the strategy is up 20% over the prior 3 months. There have only been several trades since May 10 (last update), mainly because gaps that have occurred have been too large, and the overall results of those several trades have been pretty flat. No need to adjust anything yet.
July 4, 2026
Settings remain the same. After a flat period, there was a big win on July 1.
+29.25% over the last 90 days. 61% win rate. 1.75 profit factor. 9% max drawdown.

Cory Mitchell, CMT
Disclaimer: Nothing in this article is personal investment advice, or advice to buy or sell anything. Trading is risky and can result in substantial losses, even more than deposited if using leverage. Affiliate links are used on the site: If you purchase a product via one of these links, this site may be compensated at no cost to you. Thank you for supporting the site in this way. Past results/performance isn’t always indicative of future results/performance.